

Function recovery after chemobleaching (FRAC): evidence for activity silent membrane receptors on cell surface
- PMID: 15548608
- PMCID: PMC534715
- DOI: 10.1073/pnas.0404178101
Function recovery after chemobleaching (FRAC): evidence for activity silent membrane receptors on cell surface
Abstract
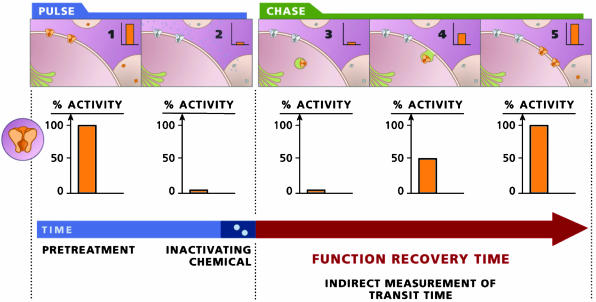
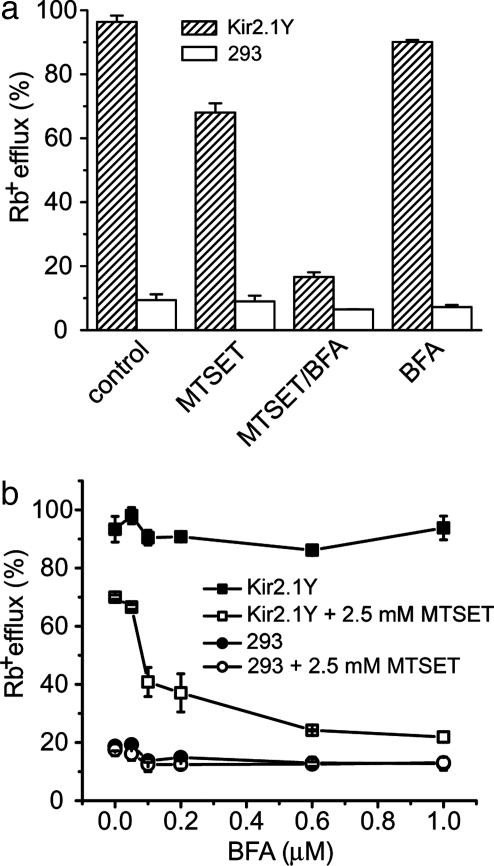
Membrane proteins represent approximately 30% of the proteome of both prokaryotes and eukaryotes. Unique to cell surface receptors is their biogenesis pathway, which involves vesicular trafficking from the endoplasmic reticulum through the Golgi apparatus and to the cell surface. Increasing evidence suggests specific regulation of biogenesis for different membrane receptors, hence affecting their surface expression. We report the development of a pulse-chase assay to monitor function recovery after chemobleaching (FRAC) to probe the transit time of the Kir2.1 K+ channel to reach the cell surface. Our results reveal that the channel activity is contributed by a small fraction of channel protein, providing evidence of activity-silent "sleeping" molecules on the cell surface. This method distinguishes molecular density from functional density, and the assay strategy is generally applicable to other membrane receptors. The ability of the reported method to access the biogenesis pathways in a high-throughput manner facilitates the identification and evaluation of molecules affecting receptor trafficking.
Figures
Similar articles
-
Genetic isolation of transport signals directing cell surface expression.Nat Cell Biol. 2005 Oct;7(10):985-92. doi: 10.1038/ncb1297. Epub 2005 Sep 11. Nat Cell Biol. 2005. PMID: 16155591
-
Glutamate receptors and endoplasmic reticulum quality control: looking beneath the surface.Neuroscientist. 2006 Jun;12(3):232-44. doi: 10.1177/1073858405283828. Neuroscientist. 2006. PMID: 16684968 Review.
-
Olfactory receptor interactions with other receptors.Ann N Y Acad Sci. 2009 Jul;1170:147-9. doi: 10.1111/j.1749-6632.2009.03879.x. Ann N Y Acad Sci. 2009. PMID: 19686125
-
Effects of foot-and-mouth disease virus nonstructural proteins on the structure and function of the early secretory pathway: 2BC but not 3A blocks endoplasmic reticulum-to-Golgi transport.J Virol. 2005 Apr;79(7):4382-95. doi: 10.1128/JVI.79.7.4382-4395.2005. J Virol. 2005. PMID: 15767438 Free PMC article.
-
An escort for GPCRs: implications for regulation of receptor density at the cell surface.Trends Pharmacol Sci. 2008 Oct;29(10):528-35. doi: 10.1016/j.tips.2008.07.009. Epub 2008 Aug 27. Trends Pharmacol Sci. 2008. PMID: 18760490 Review.
Cited by
-
Isoform-specific prolongation of Kv7 (KCNQ) potassium channel opening mediated by new molecular determinants for drug-channel interactions.J Biol Chem. 2010 Sep 3;285(36):28322-32. doi: 10.1074/jbc.M110.116392. Epub 2010 Jun 28. J Biol Chem. 2010. PMID: 20584905 Free PMC article.
-
Regulation of Kir2.1 channels by the Rho-GTPase, Rac1.J Cell Physiol. 2009 Feb;218(2):385-93. doi: 10.1002/jcp.21610. J Cell Physiol. 2009. PMID: 18932198 Free PMC article.
-
Extracellular pH dynamically controls cell surface delivery of functional TRPV5 channels.Mol Cell Biol. 2007 Feb;27(4):1486-94. doi: 10.1128/MCB.01468-06. Epub 2006 Dec 18. Mol Cell Biol. 2007. PMID: 17178838 Free PMC article.
-
Bioluminescence assay for detecting cell surface membrane protein expression.Assay Drug Dev Technol. 2011 Feb;9(1):31-9. doi: 10.1089/adt.2010.0278. Epub 2010 Sep 13. Assay Drug Dev Technol. 2011. PMID: 20836709 Free PMC article.
-
Emerging approaches to probing ion channel structure and function.Neurosci Bull. 2012 Aug;28(4):351-74. doi: 10.1007/s12264-012-1248-0. Neurosci Bull. 2012. PMID: 22833035 Free PMC article. Review.
References
-
- Pfeffer, S. (2003) Cell 112, 507-517. - PubMed
-
- Ellgaard, L. & Helenius, A. (2003) Nat. Rev. Mol. Cell Biol. 4, 181-191. - PubMed
-
- Mellman, I. & Warren, G. (2000) Cell 100, 99-112. - PubMed
-
- Ma, D. & Jan, L. Y. (2002) Curr. Opin. Neurobiol. 12, 287-292. - PubMed
-
- Blanpied, T. A., Scott, D. B. & Ehlers, M. D. (2003) Neurobiol. Aging 24, 1095-1104. - PubMed
Publication types
MeSH terms
Substances
LinkOut - more resources
Full Text Sources
Other Literature Sources
