

A small-molecule switch for Golgi sulfotransferases
- PMID: 15548609
- PMCID: PMC534710
- DOI: 10.1073/pnas.0403681101
A small-molecule switch for Golgi sulfotransferases
Abstract
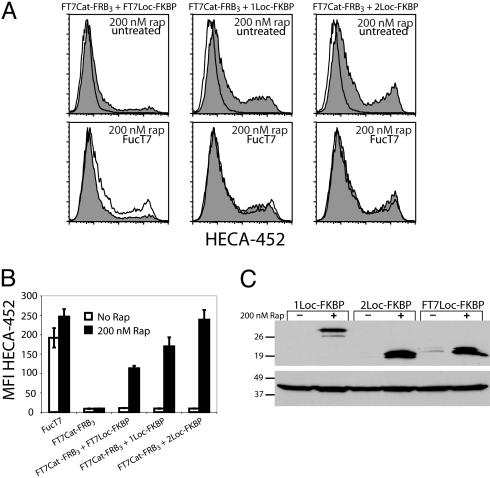
The study of glycan function is a major frontier in biology that could benefit from small molecules capable of perturbing carbohydrate structures on cells. The widespread role of sulfotransferases in modulating glycan function makes them prime targets for small-molecule modulators. Here, we report a system for conditional activation of Golgi-resident sulfotransferases using a chemical inducer of dimerization. Our approach capitalizes on two features shared by these enzymes: their requirement of Golgi localization for activity on cellular substrates and the modularity of their catalytic and localization domains. Fusion of these domains to the proteins FRB and FKBP enabled their induced assembly by the natural product rapamycin. We applied this strategy to the GlcNAc-6-sulfotransferases GlcNAc6ST-1 and GlcNAc6ST-2, which collaborate in the sulfation of L-selectin ligands. Both the activity and specificity of the inducible enzymes were indistinguishable from their WT counterparts. We further generated rapamycin-inducible chimeric enzymes comprising the localization domain of a sulfotransferase and the catalytic domain of a glycosyltransferase, demonstrating the generality of the system among other Golgi enzymes. The approach provides a means for studying sulfate-dependent processes in cellular systems and, potentially, in vivo.
Figures


Similar articles
-
Golgi localization of carbohydrate sulfotransferases is a determinant of L-selectin ligand biosynthesis.J Biol Chem. 2003 Oct 10;278(41):40282-95. doi: 10.1074/jbc.M304928200. Epub 2003 Jul 10. J Biol Chem. 2003. PMID: 12855678
-
The stem region of the sulfotransferase GlcNAc6ST-1 is a determinant of substrate specificity.J Biol Chem. 2004 Sep 17;279(38):40035-43. doi: 10.1074/jbc.M405709200. Epub 2004 Jun 25. J Biol Chem. 2004. PMID: 15220337
-
Regulating cell surface glycosylation with a small-molecule switch.Methods Enzymol. 2006;415:213-29. doi: 10.1016/S0076-6879(06)15014-4. Methods Enzymol. 2006. PMID: 17116477
-
Strategies for drug discovery by targeting sulfation pathways.Drug Discov Today. 2004 Nov 15;9(22):967-75. doi: 10.1016/S1359-6446(04)03261-1. Drug Discov Today. 2004. PMID: 15539140 Review.
-
Protein tyrosine sulfation, 1993--an update.Chem Biol Interact. 1994 Jun;92(1-3):257-71. doi: 10.1016/0009-2797(94)90068-x. Chem Biol Interact. 1994. PMID: 8033259 Review.
Cited by
-
A dual small-molecule rheostat for precise control of protein concentration in Mammalian cells.Chembiochem. 2014 Apr 14;15(6):805-9. doi: 10.1002/cbic.201400006. Epub 2014 Mar 11. Chembiochem. 2014. PMID: 24615791 Free PMC article.
-
Imaging the glycome.Proc Natl Acad Sci U S A. 2009 Jan 6;106(1):12-7. doi: 10.1073/pnas.0811481106. Epub 2008 Dec 22. Proc Natl Acad Sci U S A. 2009. PMID: 19104067 Free PMC article. Review.
-
Modification degrees at specific sites on heparan sulphate: an approach to measure chemical modifications on biological molecules with stable isotope labelling.Biochem J. 2005 Jul 15;389(Pt 2):383-8. doi: 10.1042/BJ20041827. Biochem J. 2005. PMID: 15743272 Free PMC article.
-
Synthesis of orthogonally reactive FK506 derivatives via olefin cross metathesis.Bioorg Med Chem. 2009 Aug 15;17(16):5763-8. doi: 10.1016/j.bmc.2009.07.030. Epub 2009 Jul 18. Bioorg Med Chem. 2009. PMID: 19643614 Free PMC article.
-
Small-molecule control of protein degradation using split adaptors.ACS Chem Biol. 2011 Nov 18;6(11):1205-13. doi: 10.1021/cb2001389. Epub 2011 Sep 8. ACS Chem Biol. 2011. PMID: 21866931 Free PMC article.
References
-
- Specht, K. M. & Shokat, K. M. (2002) Curr. Opin. Cell Biol. 14, 155–159. - PubMed
-
- Mayer, T. U. (2003) Trends Cell Biol. 13, 270–277. - PubMed
-
- Yeh, J. R. & Crews, C. M. (2003) Dev. Cell 5, 11–19. - PubMed
-
- Bishop, A., Buzko, O., Heyeck-Dumas, S., Jung, I., Kraybill, B., Liu, Y., Shah, K., Ulrich, S., Witucki, L., Yang, F., et al. (2000) Annu. Rev. Biophys. Biomol. Struct. 29, 577–606. - PubMed
Publication types
MeSH terms
Substances
Grants and funding
LinkOut - more resources
Full Text Sources
Other Literature Sources
