

Recycling Frank: Spontaneous emergence of homochirality in noncatalytic systems
- PMID: 15548617
- PMCID: PMC534711
- DOI: 10.1073/pnas.0405293101
Recycling Frank: Spontaneous emergence of homochirality in noncatalytic systems
Abstract
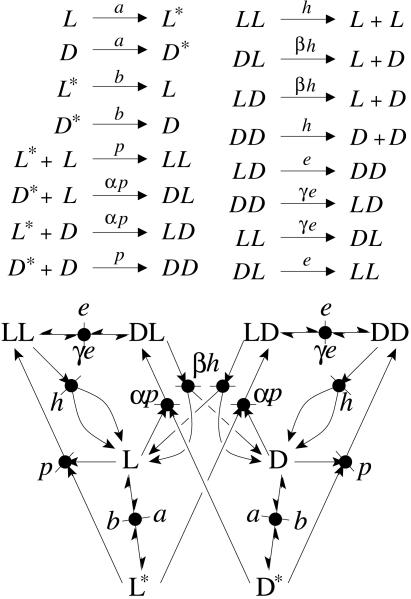
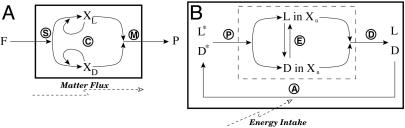
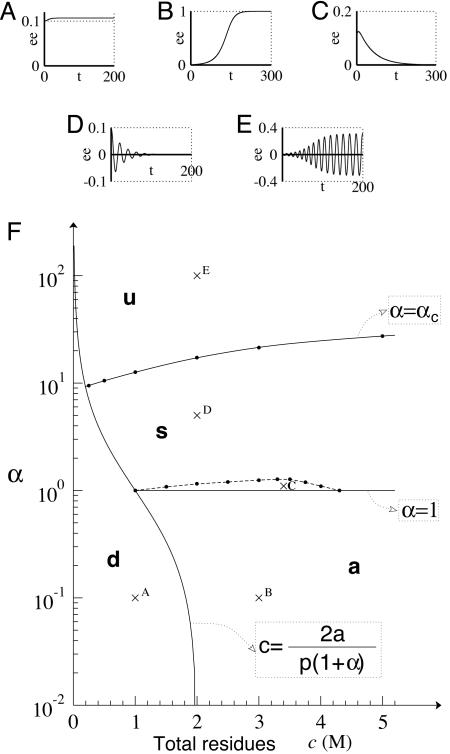
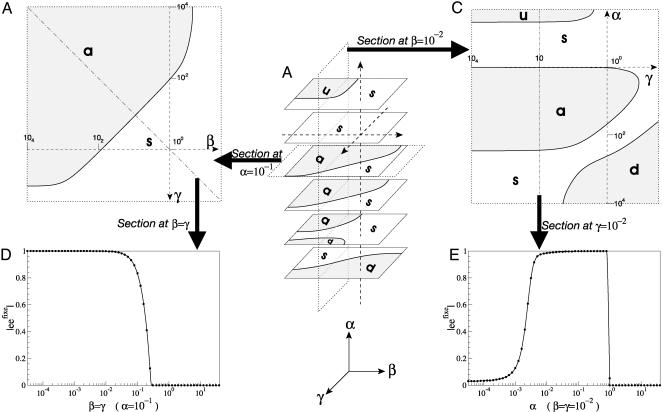
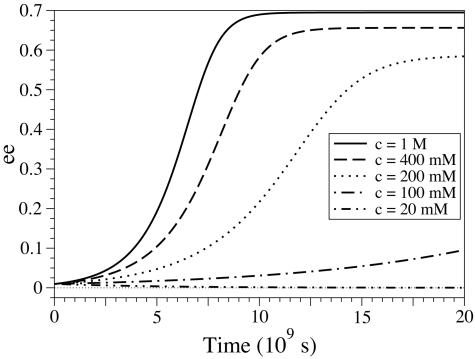
In this work, we introduce a prebiotically relevant protometabolic pattern corresponding to an engine of deracemization by using an external energy source. The spontaneous formation of a nonracemic mixture of chiral compounds can be observed in out-of-equilibrium systems via a symmetry-breaking phenomenon. This observation is possible thanks to chirally selective autocatalytic reactions (Frank's model) [Frank, F. C. (1953) Biochim. Biophys. Acta 11, 459-463]. We show that the use of a Frank-like model in a recycled system composed of reversible chemical reactions, rather than the classical irreversible system, allows for the emergence of a synergetic autoinduction from simple reactions, without any autocatalytic or even catalytic reaction. This model is described as a theoretical framework, based on the stereoselective reactivity of preexisting chiral monomeric building blocks (polymerization, epimerization, and depolymerization) maintained out of equilibrium by a continuous energy income, via an activation reaction. It permits the self-conversion of all monomeric subunits into a single chiral configuration. Real prebiotic systems of amino acid derivatives can be described on this basis. They are shown to be able to spontaneously reach a stable nonracemic state in a few centuries. In such systems, the presence of epimerization reactions is no more destructive, but in contrast is the central driving force of the unstabilization of the racemic state.
Figures
Similar articles
-
Emergence of homochirality in far-from-equilibrium systems: mechanisms and role in prebiotic chemistry.Chirality. 2007 Aug;19(8):589-600. doi: 10.1002/chir.20440. Chirality. 2007. PMID: 17559107 Review.
-
Necessary conditions for the emergence of homochirality via autocatalytic self-replication.J Chem Phys. 2016 Aug 21;145(7):074111. doi: 10.1063/1.4961021. J Chem Phys. 2016. PMID: 27544091
-
Spontaneous emergence of homochirality via coherently coupled antagonistic and reversible reaction cycles.Chemphyschem. 2008 Nov 10;9(16):2359-71. doi: 10.1002/cphc.200800226. Chemphyschem. 2008. PMID: 18942050
-
Viedma deracemization mechanisms in self-assembly processes.Phys Chem Chem Phys. 2025 Jan 29;27(5):2516-2527. doi: 10.1039/d4cp03910f. Phys Chem Chem Phys. 2025. PMID: 39804208
-
Possible chemical and physical scenarios towards biological homochirality.Chem Soc Rev. 2022 May 10;51(9):3436-3476. doi: 10.1039/d1cs01179k. Chem Soc Rev. 2022. PMID: 35377372 Review.
Cited by
-
Emergence of native peptide sequences in prebiotic replication networks.Nat Commun. 2017 Sep 5;8(1):434. doi: 10.1038/s41467-017-00463-1. Nat Commun. 2017. PMID: 28874657 Free PMC article.
-
Interactions of Amino Acids and Aminoxazole Derivatives: Cocrystal Formation and Prebiotic Implications Enabled by Computational Analysis.Orig Life Evol Biosph. 2019 Sep;49(3):163-185. doi: 10.1007/s11084-019-09582-9. Epub 2019 Jul 20. Orig Life Evol Biosph. 2019. PMID: 31327111
-
The Limited Roles of Autocatalysis and Enantiomeric Cross-Inhibition in Achieving Homochirality in Dilute Systems.Orig Life Evol Biosph. 2019 Jun;49(1-2):49-60. doi: 10.1007/s11084-019-09579-4. Epub 2019 Jul 8. Orig Life Evol Biosph. 2019. PMID: 31286343
-
Spontaneous chiral symmetry breaking in a random driven chemical system.Nat Commun. 2022 Apr 26;13(1):2244. doi: 10.1038/s41467-022-29952-8. Nat Commun. 2022. PMID: 35474070 Free PMC article.
-
Toward homochiral protocells in noncatalytic peptide systems.Orig Life Evol Biosph. 2009 Oct;39(5):479-93. doi: 10.1007/s11084-009-9166-5. Epub 2009 Apr 16. Orig Life Evol Biosph. 2009. PMID: 19370399
References
-
- Mislow, K. (2003) Coll. Czech. Chem. Commun. 68, 849–864.
-
- Siegel, J. S. (1998) Chirality 10, 24–27.
-
- Mason, S. F. & Tranter, G. E. (1985) Proc. R. Soc. London A 397, 45–65.
LinkOut - more resources
Full Text Sources
