Comparative Study
. 2004 Nov 17;24(46):10416-30.
doi: 10.1523/JNEUROSCI.2074-04.2004.

Stimulus and potassium-induced epileptiform activity in the human dentate gyrus from patients with and without hippocampal sclerosis

Affiliations
Comparative Study

Stimulus and potassium-induced epileptiform activity in the human dentate gyrus from patients with and without hippocampal sclerosis

Siegrun Gabriel et al. J Neurosci. .

Abstract

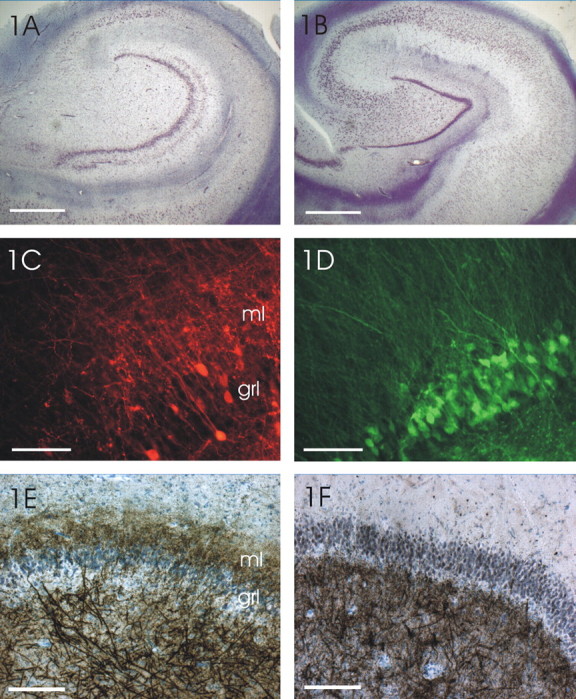
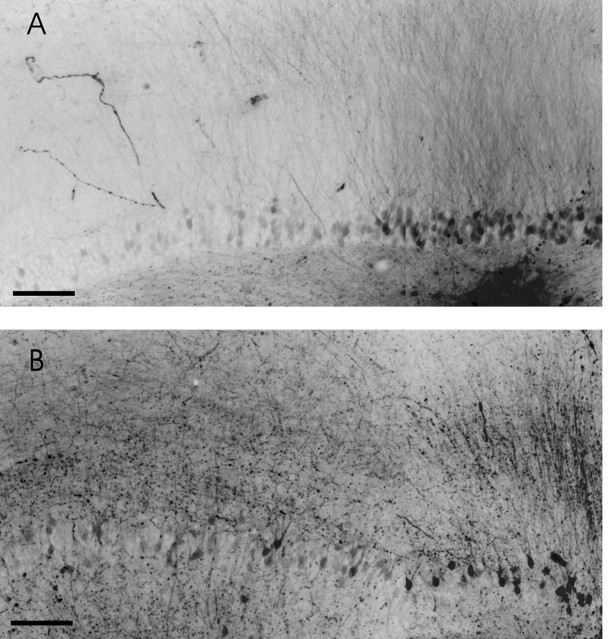
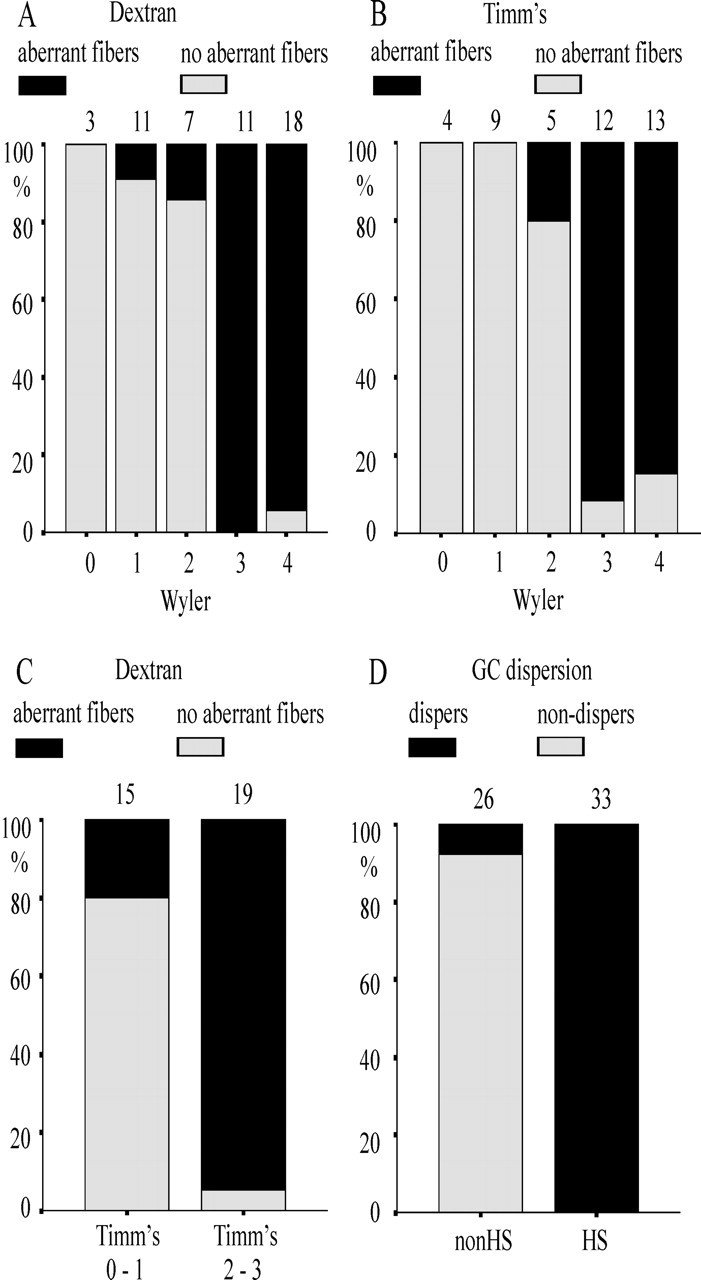
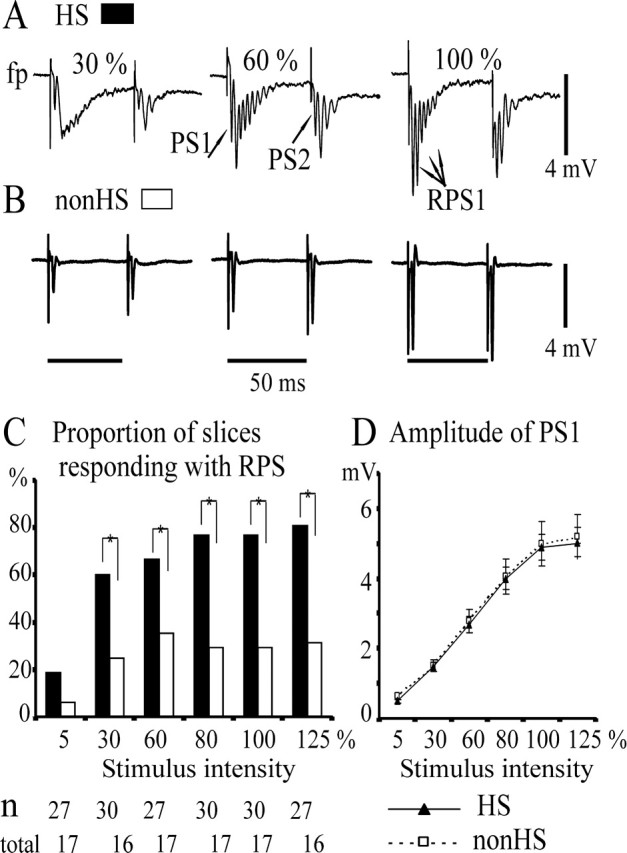
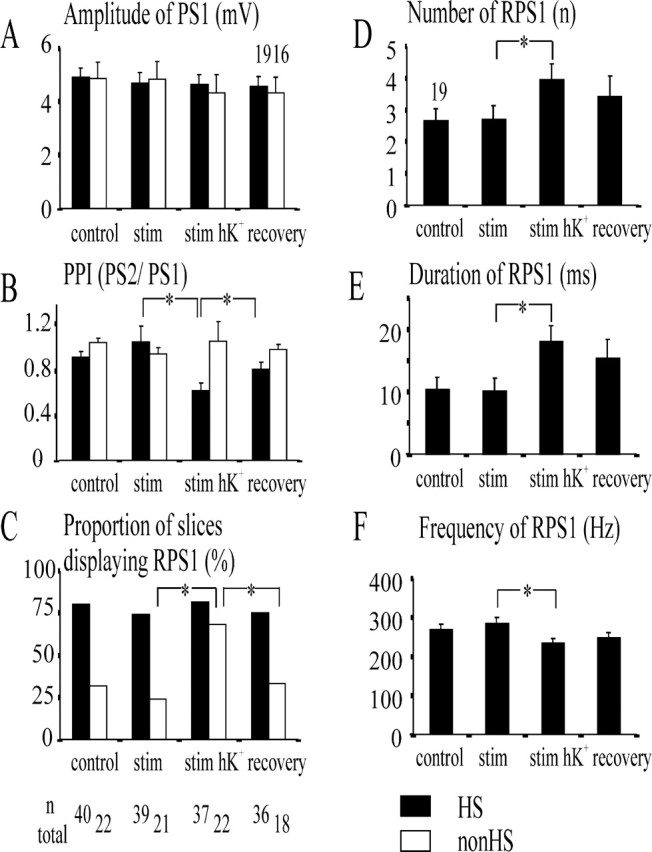
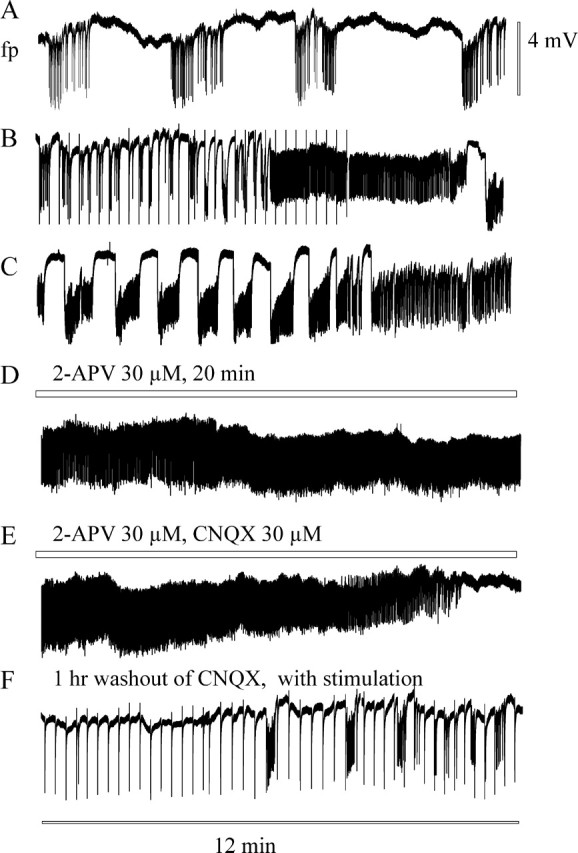
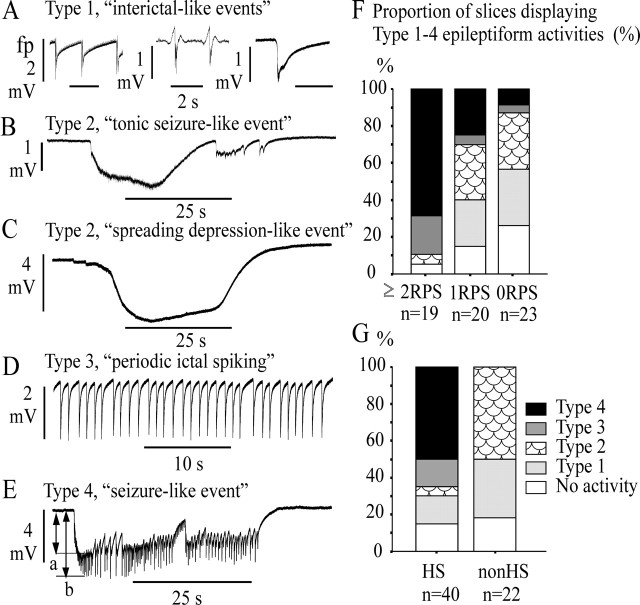
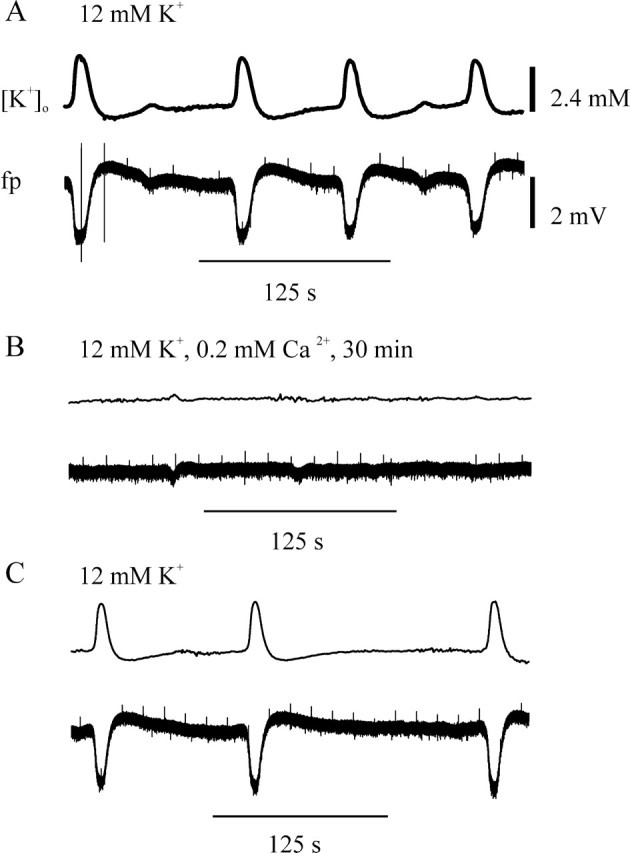
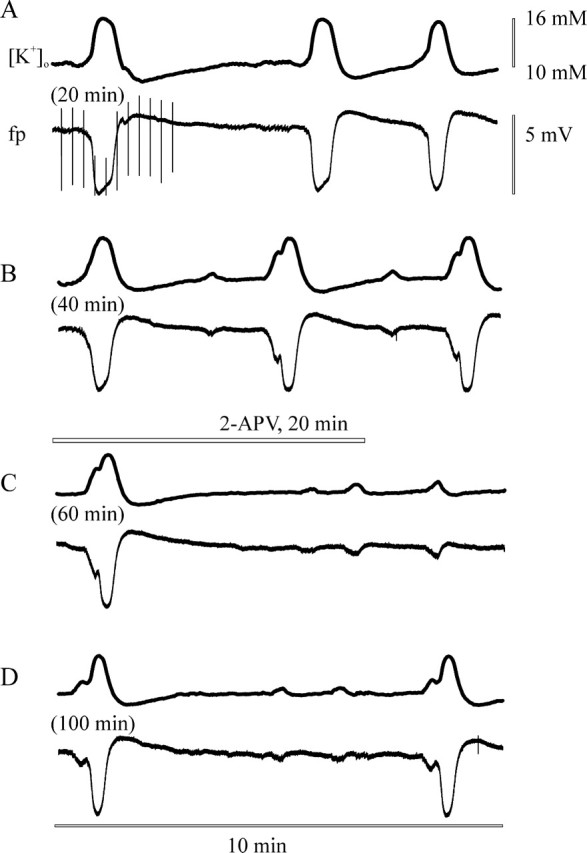
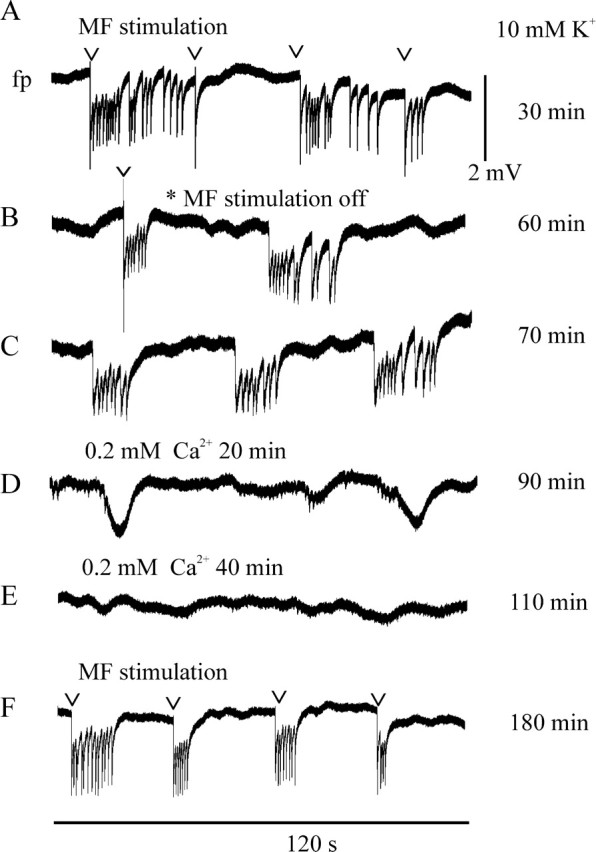
Hippocampal specimens resected to cure medically intractable temporal lobe epilepsy (TLE) provide a unique possibility to study functional consequences of morphological alterations. One intriguing alteration predominantly observed in cases of hippocampal sclerosis is an uncommon network of granule cells monosynaptically interconnected via aberrant supragranular mossy fibers. We investigated whether granule cell populations in slices from sclerotic and nonsclerotic hippocampi would develop ictaform activity when challenged by low-frequency hilar stimulation in the presence of elevated extracellular potassium concentration (10 and 12 mm) and whether the experimental activity differs according to the presence of aberrant mossy fibers. We found that ictaform activity could be evoked in slices from sclerotic and nonsclerotic hippocampi (27 of 40 slices, 14 of 20 patients; and 11 of 22 slices, 6 of 12 patients, respectively). However, the two patient groups differed with respect to the pattern of ictaform discharges and the potassium concentration mandatory for its induction. Seizure-like events were already induced with 10 mm K+. They exclusively occurred in slices from sclerotic hippocampi, of which 80% displayed stimulus-induced oscillatory population responses (250-300 Hz). In slices from nonsclerotic hippocampi, atypical negative field potential shifts were predominantly evoked with 12 mm K+. In both groups, the ictaform activity was sensitive to ionotropic glutamate receptor antagonists and lowering of [Ca2+]o. Our results show that, in granule cell populations of hippocampal slices from TLE patients, high K+-induced seizure-like activity and ictal spiking coincide with basic electrophysiological abnormalities, hippocampal sclerosis, and mossy fiber sprouting, suggesting that network reorganization could play a crucial role in determining type and threshold of such activity.


Figures

Figure 1.
Figure 1.
Coronal sections of a sclerotic (left) and a nonsclerotic hippocampus (right). A, A hippocampal formation with classical sclerosis (HS) is shown. Selective nerve cell loss in the hilus, CA3 and CA1 area, and granule cell dispersion are obvious. The granule cell dispersion led to a bilaminar pattern of granule cells (double layering). Most of the CA2 cells and few CA3 cells are still discernible. In contrast to the CA1 with a complete neuron loss, a cell band is still present in the subiculum. Scale bar, 5 mm. B, In the hippocampus of the non-HS case, all areas of the hippocampus can be recognized. The granule cell layer is compact without fringing of granule cells into the molecular layer of the dentate gyrus (cresyl violet staining). Scale bar, 5 mm. C, After injection of dextran-amine-coupled fluorescence (tetramethylrhodamine) into the hilus (bottom right corner; injection site not shown), mossy fibers can be recognized by labeled mossy fiber boutons in the hilus as well as in the molecular layer (ml) of the dentate gyrus. The labeled cells in the granule cell layer (grl) are dispersed and send their dendrites into the molecular layer (tetramethylrhodamine dextran-amine tracing). Scale bar, 50 μm. D, In a corresponding section of a non-HS case, the granule cells are densely packed and not dispersed. They are labeled with dextran-amine-coupled fluorescence (fluorescein), which was injected into the hilus. The granule cell dendrites form a regular dendritic field within the molecular layer. Mossy fiber boutons indicating mossy fibers are only seen in the hilus (bottom right corner) and not in the IML. Some hilar neurons send their processes through the granule cell layer into the molecular layer (fluorescein dextran-amine tracing). Scale bar, 50 μm. E, Timm stain indicates zinc in the mossy fibers by precipitated silver granules. By this way, zinc is visible in the hilus, stratum lucidum (data not shown), and in the IML of sclerotic hippocampi. A few Timm granules are also discernible in the granule cell layer, but most of the silver granules are found in the IML. This suggests that mossy fibers sprout back into the IML, which corresponds to the finding in C. Scale bar, 100 μm. F, In the nonsclerotic hippocampus, Timm granules are only seen in the hilus (and the mossy fiber tract) and never in the IML. As in the dentate gyrus of sclerotic hippocampi, some Timm granules can be seen within the granule cell layer (neo-Timm staining). Scale bar, 100 μm.
Figure 2.
Figure 2.
Mossy fibers in the DG of HS and non-HS patients. (Both images are composed of two originals fused between the middle and right third of the figure. The color was converted into gray scale and inverted.) A, Labeling (bottom right corner) of anon-HS case with fluorescein dextran-amine in the dense mossy fiber network in the hilus. The mossy fibers are discernible by showing the fluorescein-filled boutons. They spread only in the hilus. No mossy fibers are visible in the IML. The granule cells are retrogradely stained and form a compact layer of cells. The dendrites of the granule cells form a dense and uniform pattern, which is only interrupted by fibers of hilar neurons. The latter cells are probable interneurons and send their dendrites (processes covered with spines; data not shown) through the granule cell layer and the whole molecular layer into its outer part, in which they end in meanders. Scale bar, 100 μm. B, An HS case with a corresponding labeling site as in A. The number of labeled granule cells and their dendrites is lower as a result of loss and dispersion of the cells. Nevertheless, the frequency of mossy fiber boutons in the hilus is higher. Furthermore, aberrant longitudinal and transverse mossy fibers are seen in the IML. Both findings point to a sprouting of mossy fibers within the hilus and into the IML (fluorescein dextran-amine tracing). Scale bar, 100 μm.
Figure 3.
Figure 3.
Aberrant sprouting of mossy fibers and granule cell dispersion in different patient groups. A, Proportion of cases presenting with dextran-amine-labeled mossy fibers in the IML (aberrant fibers; black label) in patient groups assigned to Wyler grades 0-4. Cases with aberrant fibers predominated in the groups presenting with classical and strong sclerosis. B, Proportion of cases displaying typical zinc precipitation in the IML (Timm scores 2 and 3 are labeled black) in patient groups assigned to Wyler grades 0-4. Note a dramatic increase from Wyler grade 2 to Wyler grade 3 (classical HS). C, Proportion of cases with positive dextran-amine labeling (black label) in Timm-positive specimens (scores 2 and 3). There is a high coincidence of positive as well as negative labeling provided by the two methods. D, Proportion of cases with dispersion of granule cells (black) in the non-HS and HS groups. All specimens with HS presented with dispersion of granule cells. Wyler grades: 0, no sclerosis; 1, mild sclerosis; 2, moderate sclerosis; 3, classical sclerosis; 4, total sclerosis.
Figure 4.
Figure 4.
Field potential responses to paired electrical stimulation at the hilus/CA3 border (MF stimulation): differences between HS and non-HS slices. Extracellular recordings from the granule cell layer of the dentate gyrus; hilar stimulation (paired pulses, interval 50 msec, applied every 20 sec) with intensities eliciting a first population spike (PS1) of 5, 30, 60, 80, and 100% of the maximal amplitude and with supramaximal intensity (125%). A, Averaged sample traces (n = 5) of RPS responses after stimuli of 30, 60, and 80% intensity in an HS slice. B, Single population spike responses after similar stimulation in a non-HS slice. In A and B, the calibration bar for the size of field potential transients is to the right. In B, the calibration bar for the time is below. C, D, Stimulus dependence of responses to the first stimulus of the pair. Categories of increasing stimulus intensities are given on the abscissa. C, Proportion of slices displaying recurrent population spikes in response to the first stimulus of the pair in the HS group (black columns) and in the non-HS group (white columns). The total number of slices analyzed for each stimulus intensity and group is given below the category axis (HS, top; non-HS, bottom). Recurrent population spikes predominated in the HS group and are less numerous at threshold intensity. D, Stimulus dependence of the first population spike (PS1). Marker and error bar represent mean value and SEM, respectively. Lines and markers for HS and non-HS groups are given below the x-axis. There are no differences between HS slices (total, n = 34-39) and non-HS slices (total, n = 19-21). Asterisks indicate a significant difference (p = 0.05).
Figure 5.
Figure 5.
Modulation of responses to paired hilar stimulation during the induction of epileptiform activity by continuous low-frequency stimulation (stim) and stimulation in the presence of high K+-containing ACSF (stim hK+). Stimuli (50 msec interval; 80% intensity) were applied every 15 sec. All graphs except C display mean values and SEM (error bars). A and B show data analyzed listwise from 19 HS slices (black columns) and 16 non-HS slices (white columns), whereas in C, the proportions of slices responding with recurrent population spikes refer to the number of slices tested under the different conditions (numbers below the category axis). The parameters analyzed are defined at the top right of each ordinate, and categories of conditions are given below the abscissa. A, Amplitude of the first population spike (PS1). There is no modulation at all, in either HS slices or non-HS slices. B, Paired-pulse index [PPI (PS2/PS1); PS2 and PS1 are the first population spikes in response to the second/first stimulus of the pair]. The index reversibly decreased during stimulation in the presence of high K+-containing ACSF in HS slices but not in non-HS slices. C, Proportion of slices displaying recurrent population spikes (RPS1). The proportion of HS slices did not change, but that of non-HS slices reversibly increased during stimulation in the presence of high K+-containing ACSF. D-F display data from 19 HS slices. D, Number; E, duration; F, frequency of recurrent population spikes. Note an increase in the number, a prolongation of the duration, and a decline of the frequency under conditions of stimulation in the presence of high K+-containing ACSF, which had only partly recovered 60-90 min after washout of high K+-containing ACSF. Asterisks indicate a significant difference (p = 0.05).
Figure 8.
Figure 8.
Seizure-like events (type 4) followed by recurrent short discharges: time course and effect of 30 μm CNQX in an HS slice. Calibration bars for size of field potential shifts (to the right of A) and for time (below F) apply to all traces. A, Transient period of spontaneous epileptiform activity that occurred in the absence of high K+ after testing the stimulus dependence of responses to hilar stimulation during the control period. B, Reappearance of short stimulus-associated events after 15 min of stimulation in the presence of 10 mm K+-containing ACSF and transition to typical self-sustaining seizure-like events. C, After another 10 min. Note the very long-lasting seizure-like event at the end of the trace that changed into 1 Hz activity. D, Application of 30 μm 2-APV 20 min before and during the trace had no effect on the activity. E, Additional application of 30 μm CNQX at start of this trace led to fast suppression of the activity. F, Reappearance of short stimulus-associated events after 1 hr washout of 2-APV and CNQX (with hilar stimulation throughout the last 15 min). Hilar stimulation: 50 msec interval, 80% intensity, every 15 sec.
Figure 6.
Figure 6.
Types and occurrence of self-sustained epileptiform activity. The activity was induced by paired hilar stimulation and subsequent stimulation in the presence of 10-12 mm [K+]o for at least 20 min. In A-E, the calibration bars for the size of potential shifts are at the left of each trace, and the calibration bar for time is below the traces. A, Type 1, Short-lasting field potential transients from three different slices. B, C, Type 2, Long-lasting field potential shifts mimicking tonic seizure-like events (B) or spreading depression-like events (C), always characterized by absence of clonic-like discharges. D, Type 3, Recurrent short discharges (1 Hz) mimicking ictal spiking. E, Type 4, Seizure-like events. F, G, Proportion of slices displaying types 1-4 epileptiform activity in slice groups responding with different numbers of RPSs (F) and in slice groups from HS and non-HS specimens (G). Ordinates in F and G are similar, with definition at top right of the axis in F. Sample size is given below each column. Note that types 4 and 3 activity dominated in slices that displayed two or more recurrent population spikes and exclusively occurred in HS slices. Type 2 preferentially developed in non-HS slices displaying one or no recurrent population spikes. Hilar stimulation (50 msec interval, 80% intensity, every 15 sec) lasted for 30-40 min to test whether epileptiform activity would develop in the absence of high K+.
Figure 10.
Figure 10.
Tonic seizure-like events (type 2) in a non-HS slice: effect of lowering [Ca2+] in the perfusion solution to 0.2 mm. Pairs of synchronous traces of [K+]o and field potential are shown. Denotation for changes in [K+]o and field potential are like that in Figure 9. A, Transition from stimulation-associated events to self-sustaining activity. B, Disappearance of spontaneous events after perfusion with 0.2 mm Ca2+-containing and 12 mm K+-containing ACSF. C, Reappearance of spontaneous events 30 min after solution change to normal Ca2+ and 12 mm K+-containing ACSF. Hilar stimulation: 50 msec interval, 80% intensity, every 15 sec.
Figure 9.
Figure 9.
Spreading depression-like events (type 2): time course and effect of 2-APV in a non-HS slice. Pairs of synchronous traces of [K+]o and field potential are displayed. Changes of [K+]o measured in millivolts were transferred into millimolar changes according to the Nernst equation. Calibration bars for size of changes in [K+]o and field potential shifts (to the right of A) and for time (below D) apply to all traces. A, Last stimulation-associated and subsequent self-sustaining events. The trace started after 50 min of hilar stimulation and after 20 min of perfusion with 12 mm K+-containing ACSF. B, Twenty minutes later. C, Blocking effect of 2-APV after 20 min of application. D, Reappearance of less frequently occurring events, 40 min after washout of 2-APV. Numbers at the start of the traces indicate time of perfusion with high K+-containing ACSF. Hilar stimulation: 50 msec interval, 80% intensity, every 15 sec.
Figure 7.
Figure 7.
Seizure-like events (type 4): time course and effect of low Ca2+-containing ACSF in an HS slice. The calibration bars for size of field potential shifts (to the right of A) and for time (below F) apply to all traces. Numbers at the right display the time course of the experiment. A, Seizure-like events associated with paired hilar stimulation (50 msec interval, 80% intensity, every 15 sec; here, already 30 sec). B, Transition to self-sustained activity. C, Self-sustained seizure-like events. D, Effect of lowering the [Ca2+]o to 0.2 mm. The events are blocked after 20 min of perfusion, but some slow field potential shifts remained. E, Complete suppression of ictaform activity. F, Reappearance of stimulus-associated events 20 min after solution change to normal Ca2+ in 10 mm K+-containing ACSF.

Similar articles

Cited by

References

    1. Babb TL, Brown WJ, Pretorius JK, Davenport CJ, Lieb JP, Crandall PH (1984) Temporal lobe volumetric cell densities in temporal lobe epilepsy. Epilepsia 25: 729-740. - PubMed
    1. Babb TL, Kupfer WR, Pretorius JK, Crandall PH, Lévesque MF (1991) Synaptic reorganization by mossy fibers in human epileptic fascia dentata. Neuroscience 42: 351-363. - PubMed
    1. Babb TL, Mathern GW, Leite JP, Pretorius JK, Yeoman KM, Kuhlman PA (1996) Glutamate AMPA receptors in the fascia dentata of human and kainate rat hippocampal epilepsy. Epilepsy Res 26: 193-205. - PubMed
    1. Baumgartner C, Elger CE, Hufnagel A, Oppel F, Runge U, Schramm J, Stefan H, Steinhoff BJ, Wieser HG, Zentner J (2000) Qualitätsrichtlinien auf dem Gebiet der prächirurgischen Epilepsiediagnostik und operativen Epilepsietherapie. Akt Neurol 27: 88-89.
    1. Beck H, Blümcke I, Kral T, Clusmann H, Schramm J, Wiestler OD, Heinemann U, Elger CE (1996) Properties of a delayed rectifier potassium current in dentate granule cells isolated from the hippocampus of patients with chronic temporal lobe epilepsy. Epilepsia 37: 892-901. - PubMed

Publication types

MeSH terms