. 2004 Nov 17;24(46):10530-41.
doi: 10.1523/JNEUROSCI.3572-04.2004.

Postnatal neurogenesis and gliogenesis in the olfactory bulb from NG2-expressing progenitors of the subventricular zone

Affiliations

Postnatal neurogenesis and gliogenesis in the olfactory bulb from NG2-expressing progenitors of the subventricular zone

Adan Aguirre et al. J Neurosci. .

Erratum in

  • J Neurosci. 2004 Dec 1;24(48):1 p following 10973

Abstract

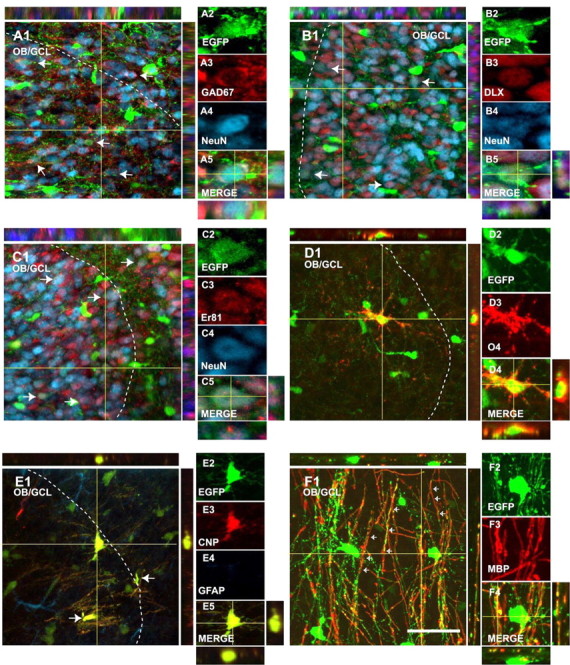
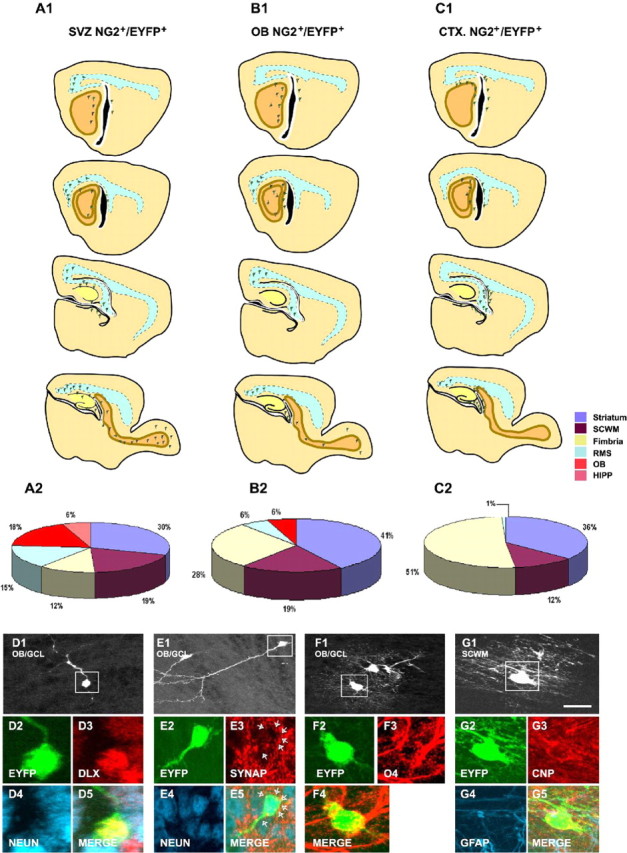
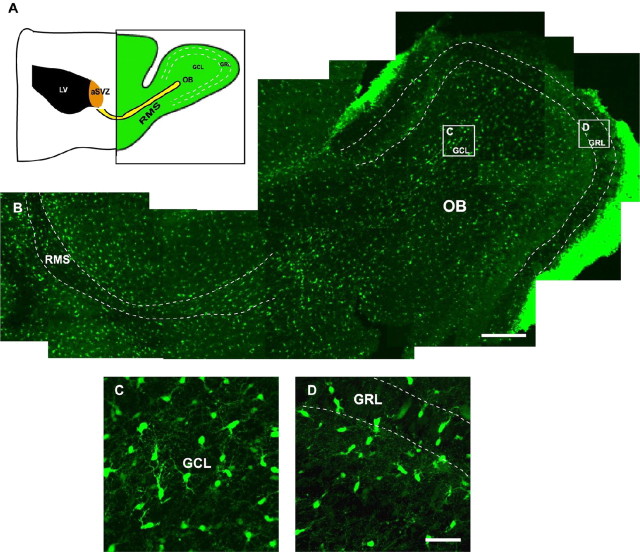
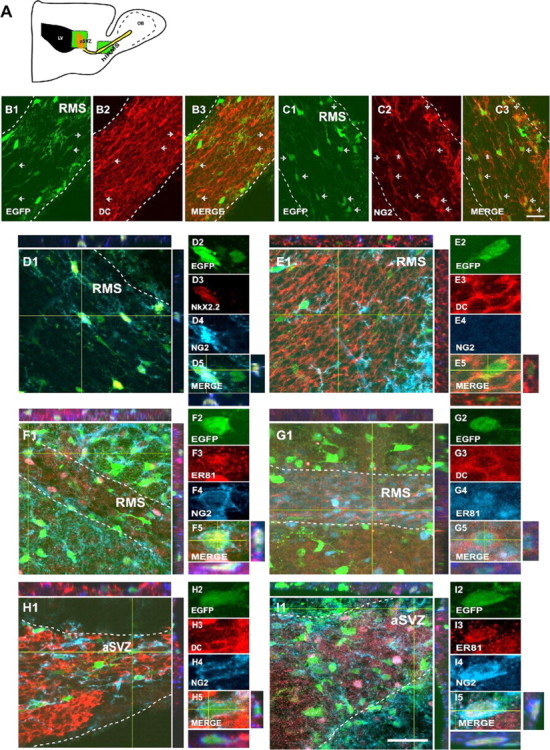
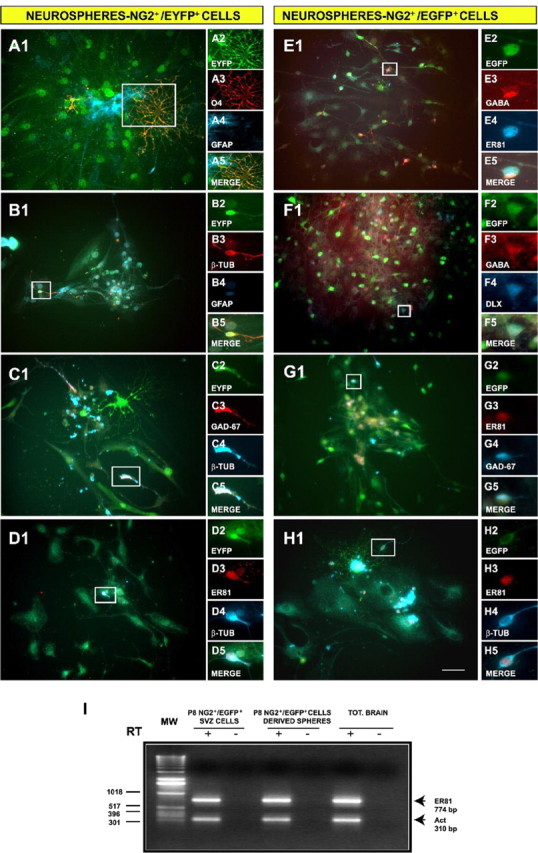
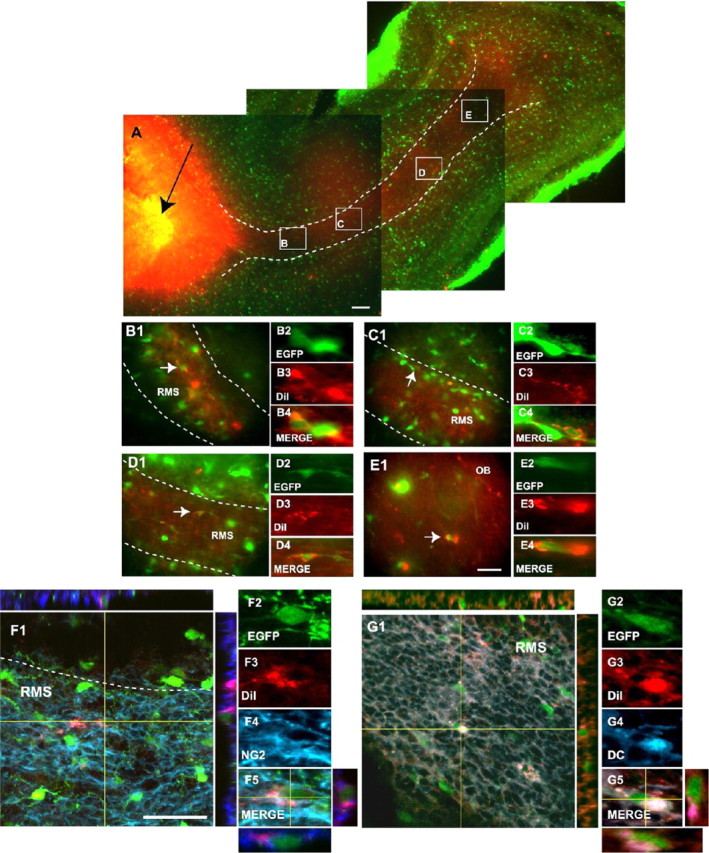
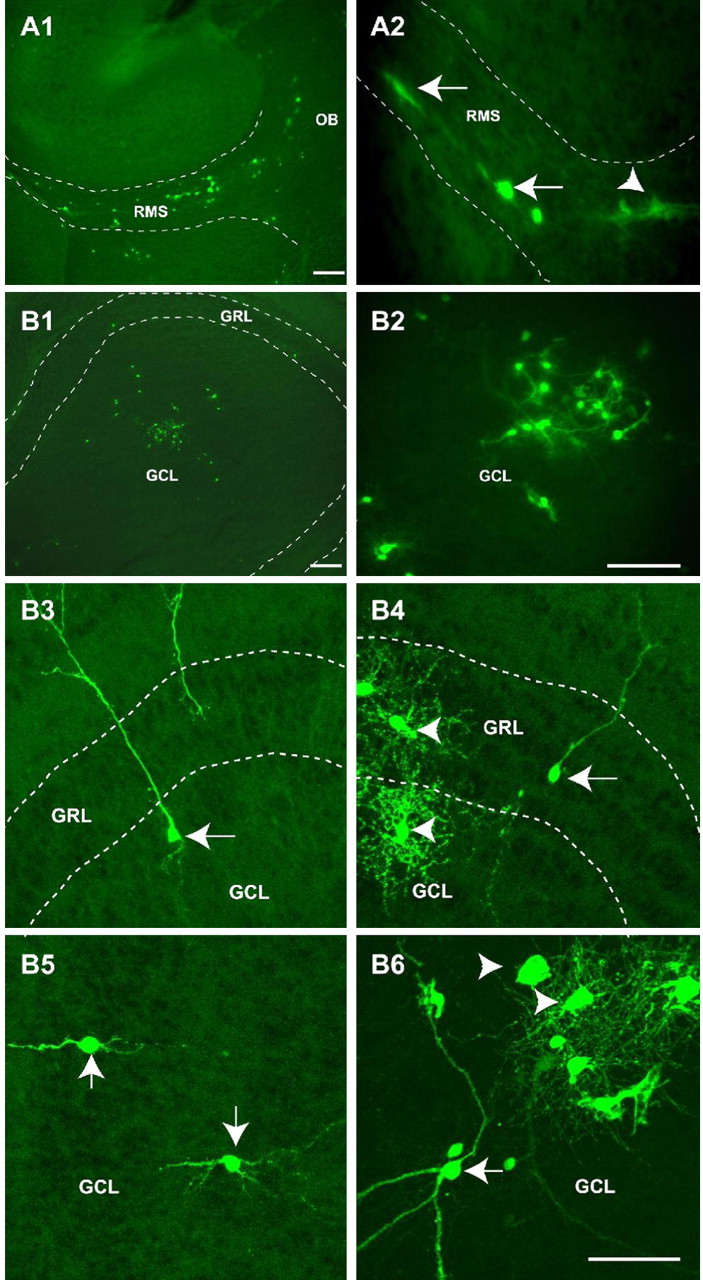
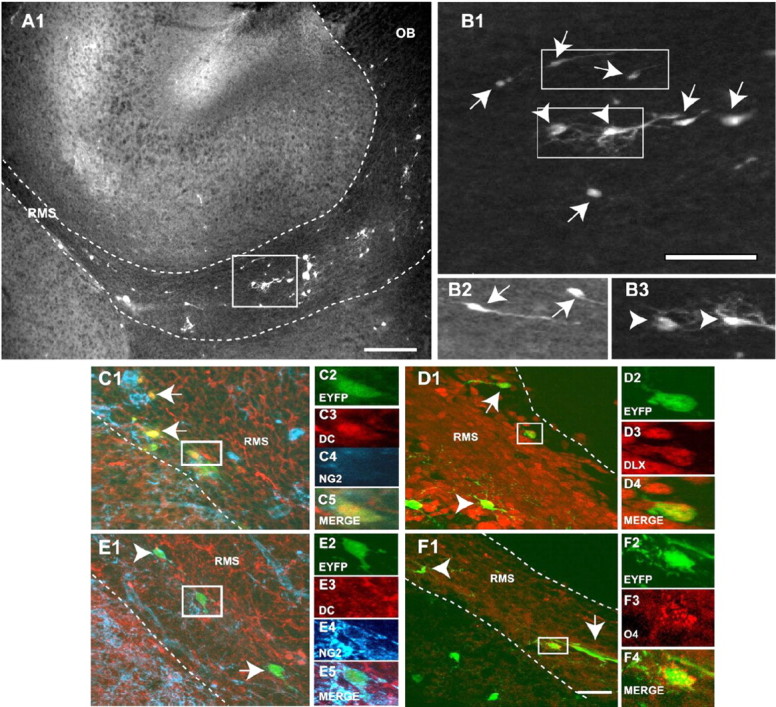
We used a 2',3'-cyclic nucleotide 3'-phosphodiesterase (CNP)-enhanced green fluorescent protein (EGFP) transgenic mouse to study postnatal subventricular zone (SVZ) progenitor fate, with a focus on the olfactory bulb (OB). The postnatal OB of the CNP-EGFP mouse contained EGFP+ interneurons and oligodendrocytes. In the anterior SVZ, the majority of EGFP+ progenitors were NG2+. These NG2+/EGFP+ progenitors expressed the OB interneuron marker Er81, the neuroblast markers doublecortin (DC) and Distalless-related homeobox (DLX), or the oligodendrocyte progenitor marker Nkx2.2. In the rostral migratory stream (RMS), EGFP+ cells displayed a migrating phenotype. A fraction of these cells were either NG2-/Er81+/DC+/DLX+ or NG2+/Nkx2.2+. DiI (1,1'-dioctadecyl-3,3,3',3'-tetramethylindocarbocyanine perchlorate) injection into the lateral ventricle (LV) of early postnatal mice demonstrated that NG2+/EGFP+ progenitors migrate from the SVZ through the RMS into the OB. Moreover, fluorescence-activated cell-sorting-purified NG2+/CNP-EGFP+ or NG2+/beta-actin-enhanced yellow fluorescent protein-positive (EYFP+) progenitors transplanted into the early postnatal LV displayed extensive rostral and caudal migration. EYFP+ or EGFP+ graft-derived cells within the RMS were DLX+/Er81+ or Nkx2.2+, migrated to the OB, and differentiated to interneurons and oligodendrocytes. In the subcortical white matter (SCWM), grafted cells differentiated to either oligodendrocytes or astrocytes. Transplantation of NG2+/EYFP+ progenitors selectively purified from the SVZ showed that these cells were migratory and generated glia and neurons in the OB, hippocampus, and striatum. In contrast, cortical, OB, or cerebellar NG2+ cells had a very limited migratory potential and gave rise to glia in the SCWM and striatum. Our findings indicate region-specific differences between NG2+ progenitor cells and show that NG2+ cells can migrate throughout the RMS and contribute to both gliogenesis and neurogenesis in the postnatal OB.


Figures

Figure 2.
Figure 2.
EGFP+ cells in the perinatal OB display neuronal and oligodendroglial phenotypes. Immunostaining of parasagittal sections from a P8 CNP-EGFP mouse brain. A significant percentage of EGFP+ cells expressed the mature neuronal marker NeuN (A4, B4, C4; blue) and the GABAergic interneuron markers GAD-67 (A3; red), DLX (B3; red), and Er81 (C3; red). A percentage of EGFP+ cells expressed the oligodendrocyte markers O4 (D3; red), CNP (E3; red), and MBP (F3; red). White dotted lines delineate the boundaries between the GCL and GRL of the OB. Orthogonal reconstructions of confocal sections in the z-axes at the level indicated by the yellow lines are shown in A1, A5, B1, B5, C1, C5, D1, D5, E1, E5, F1, and F4. The individual cells selected for multi-marker illustration are indicated at the intersections of the yellow lines. The arrows represent double positive cells. Scale bar, 50 μm.
Figure 9.
Figure 9.
Distinct migratory and lineage potential of NG2+ cells isolated from different brain regions. A1-C1, Forebrain diagrams showing representative cellular distributions of striatal-SVZ (A1), OB (B1), and cortical (C1) NG2+/EYFP+ 4 d after grafting in the LV. A2-C2, Pies representing the percentages of total grafted cells found in the striatum (purple), SCWM (brown), fimbria (yellow), RMS (blue), OB (orange), and hippocampus (pink) at 4 DAT. D, E, Representative immunohistochemical characterization of DLX+ (D3; red)/NeuN+ (D4; blue) or synaptophysin+ (SYNAP; E3, red)/NeuN+ (E4; blue) OB neurons derived from grafted SVZ NG2+/EYFP+ cells. F, Representative immunohistochemical characterization of an oligodendrocyte derived from SVZ NG2+/EYFP+ cells in the OB stained with O4 antibodies (F3; red). G, Representative immunohistochemical characterization of an oligodendrocyte derived from cortical NG2+/EYFP+ cells in the SCWM stained with anti-CNP antibodies (G3; red). Scale bar, 50 μm.
Figure 1.
Figure 1.
EGFP+ cells are present in the RMS and OB of the postnatal CNP-EGFP mouse. A, Schematic drawing of a parasagittal section of the postnatal mouse forebrain. The green-shaded area is shown in B. B, Confocal reconstruction of the RMS and OB from a parasagittal section obtained from a P8 CNP-EGFP mouse brain. A large number of EGFP+ cells are present in the RMS and in the OB. C, D, High-magnification images obtained from the boxed areas in B. Note the higher density of EGFP+ cells in the GCL than in the GRL. White dotted lines delineate the boundaries of the RMS and the boundaries between the GCL and GRL of the OB. Scale bars: B, 300 μm; C, D, 50 μm.
Figure 3.
Figure 3.
NG2+ cells in the SVZ and RMS express markers for neuronal progenitors and OPs. A, Schematic drawing of a parasagittal section of the postnatal mouse forebrain. The green boxes represent the areas selected for cell imaging and cell counting in the aSVZ and horizontal limb of the RMS (hlRMS). B1-B3, EGFP+ cells (green) are found in the hlRMS. The RMS was labeled with anti-DC (red). C1-C3, NG2 immunostaining (red) of the RMS demonstrates the presence of NG2+ progenitors in this structure. Arrows represent double positive cells, and the asterisks in C2 and C3 represent a blood vessel. D1-D5, A percentage of the NG2+ progenitors in the RMS (D4; blue) express the OP marker Nkx2.2 (D3; red). E1-E5, F1-F5, A percentage of EGFP+/NG2- cells (green/blue) express DC (E3; red) in the RMS. A percentage of the EGFP+ cells were NG2+ (F4; blue) and Er81+ (F3; red) in the RMS. G1-G5, A population of EGFP+ cells in the horizontal limb of the RMS coexpress DC (G3; red) and Er81 (G4; blue), markers for OB interneurons. H1-H5, I1-I5, A percentage of NG2+/EGFP+ cells in the aSVZ express DC (H3; red) and Er81 (I3; red). White dotted lines delineate the boundaries of the RMS. Orthogonal reconstructions of confocal sections in the z-axes at the level indicated by the yellow lines are shown in E1, E5, F1, F5, G1, G5, H1, H5, I1, and I5. The individual cells selected for multi-marker illustration are indicated at the intersections of the yellow lines. Scale bar, 50 μm.
Figure 5.
Figure 5.
NG2+ cells purified from the SVZ generate OB interneurons and oligodendrocytes in vitro. Neurospheres were generated from NG2+/EGFP+ and NG2+/EYFP+ progenitors FACS purified from the SVZ. After plating at a clonal dilution, cells were allowed to differentiate for 6 DIV. A-D, Indirect immunofluorescence analysis of their progeny indicated that NG2+/EYFP+ cells are multipotent. Oligodendrodrocytes, astrocytes, and neurons were identified by O4 (A3; red), GFAP (A4, B4; blue), and TUJ1 (B3, red; C4, D4, blue) antibodies, respectively. C-H, OB interneurons were identified in NG2+/EYFP+ (C, D) and in NG2+/EGFP+ (E-H) neurospheres using anti-GAD-67 (C3, red; G4, blue), anti-Er81 (D3, G3, H3, red; E4, blue), anti-Dlx (F4; blue), and anti-GABA (E3, F3; red) antibodies. I, The transcription factor Er81 is expressed in postnatal (P8) SVZ NG2+/EGFP+ cells (lane 2) and NG2+/EGFP+ -derived neurospheres (lane 4), as shown by RT-PCR. -, RNA that was not reverse transcribed was used as a negative control. Scale bar, 50 μm.
Figure 4.
Figure 4.
NG2+ cells migrate from the SVZ into the RMS. A-E, Reconstruction of a parasagittal brain section of a P8 CNP-EGFP mouse 4 d after DiI injection into the LV (black arrow). EGFP+ cells were found throughout the entire RMS and displayed morphologies of migratory cells. B-D, At this time, a small percentage of DiI+/EGFP+ (red/green) cells were also found in the OB (E). Boxes in A (B-E) are shown at a higher magnification, and individual DiI+/EGFP+-labeled cells (white arrows) are also displayed at a higher magnification. F, G, A percentage of the migrating DiI+/EGFP+ cells express NG2 (F4; blue) and DC (G4; blue). White dotted lines represent RMS boundaries. Orthogonal reconstructions of confocal sections in the z-axes at the level indicated by the yellow lines are shown in F1, F5, G1, and G5. The individual cells selected for multi-marker illustration are indicated at the intersections of the yellow lines. Scale bars: A, 300 μm; B-G, 50 μm.
Figure 6.
Figure 6.
Grafted NG2+/EYFP+ cells migrate rostrally into the RMS to populate the OB. A, B, NG2+/EYFP+ cells were FACS purified from P3 brains and transplanted in the LV of P3 wild-type host mice. Brains were analyzed at 4 DAT (A1, A2) and 3 WAT (B1-B6). EYFP+ cells were visualized by fluorescence microscopy. A1, A2, Migrating EYFP+ cells were observed as early as 4 DAT throughout the RMS. B1-B6, At 3 WAT, EYFP+ cells were found in the OB and displayed morphological features of neurons (arrows) and oligodendrocytes (arrowheads). These cells were observed both in the GRL and in the GCL. Dotted lines depict the RMS and the GCL of the OB in A1 and A2 and in B1, B3, and B4, respectively. Scale bars: A1, B1, 300 μm; A2, B2, 200 μm; B3-B6, 50 μm.
Figure 7.
Figure 7.
Graft-derived EYFP+ cells are found in the RMS and display different phenotypes. A1, EYFP+ cells found in the RMS show a typical unipolar or bipolar migrating morphology, but cells with a bipolar/multipolar OP morphology were also seen. B1-B3, A mixed population of unipolar/bipolar (arrows) and multipolar (arrowheads) cells was seen in the RMS. C, D, Migrating cells in the RMS express the neuroblast markers DC (C3; red) and DLX (D3; red). E, F, Multipolar cells in the RMS express NG2 (E4; blue) and the oligodendrocyte progenitor marker O4 (F3; red) and are negative for DC (E3; red). White dotted lines delineate the boundaries of the RMS. The box in A1 is shown at a higher magnification in B1. Boxes in B1 are shown at a higher magnification in B2 and B3. Scale bars: A, 300 μm; B-F, 50 μm.
Figure 8.
Figure 8.
Grafted NG2+/EYFP+ cells differentiate into region-specific interneurons and mature oligodendrocytes in the OB. Tissue analysis was performed at 3 WAT. A, B, A significant percentage of grafted EYFP+ cells are still proliferative in the OB, as demonstrated by Ki67 staining (A3, B3; red). C-F, Grafted EYFP+ cells display mature OB interneuron markers. EYFP+ cells were stained with anti-NeuN (C5, D5, E5, F5; blue), anti-GAD-67 (D4; red), anti-Dlx (E4; red), and anti-Er81 (F4; red). Tissue was also processed for immunohistochemistry with anti-GFP (C4; red) to confirm the identity of graft-derived cells. G1-G5, Grafted EYFP+ cells were labeled with the oligodendrocyte marker O4 (G4; red). H1-H6, Grafted EYFP+ cells also displayed a mature oligodendrocyte phenotype, based on CNP protein expression (H4; red) and absence of GFAP (H5; blue). In C2, D2, E2, F2, G2, and H2, EYFP expression was color converted to black and white to show the full morphology of the grafted cells. The boxes in A1 and B1 are shown at a higher magnification in A2-A4 and B2-B4. Arrows indicate cells shown at higher magnification. Scale bars, 50 μm.

References

    1. Aguirre AA, Chittajallu R, Belachew S, Gallo V (2004) NG2-expressing cells in the subventricular zone are type C-like cells and contribute to interneuron generation in the postnatal hippocampus. J Cell Biol 165: 575-589. - PMC - PubMed
    1. Belachew S, Chittajallu R, Aguirre AA, Yuan X, Kirby M, Anderson S, Gallo V (2003) Postnatal NG2 proteoglycan-expressing progenitor cells are intrinsically multipotent and generate functional neurons. J Cell Biol 161: 169-186. - PMC - PubMed
    1. Capela A, Temple S (2002) LeX/ssea-1 is expressed by adult mouse CNS stem cells, identifying them as nonependymal. Neuron 35: 865-875. - PubMed
    1. Carleton A, Petreanu LT, Lansford R, Alvarez-Buylla A, Lledo PM (2003) Becoming a new neuron in the adult olfactory bulb. Nat Neurosci 6: 507-518. - PubMed
    1. Chittajallu R, Aguirre AA, Gallo V (2004) NG2-positive cells in the white and grey matter display distinct physiological properties. J Physiol (Lond), in press. - PMC - PubMed

Publication types

MeSH terms