. 2004 Nov 17;24(46):10553-67.
doi: 10.1523/JNEUROSCI.3319-04.2004.

Dendrodendritic electrical synapses between mammalian retinal ganglion cells

Affiliations

Dendrodendritic electrical synapses between mammalian retinal ganglion cells

Soh Hidaka et al. J Neurosci. .

Abstract

Electrical synapses between alpha-type ganglion cells were detected using combined techniques of dual patch-clamp recordings, intracellular labeling, electron microscopy, and channel subunit connexin immunocytochemistry in the albino rat retina. After intracellular injection of Neurobiotin into alpha-cells of inner (ON-center) and outer (OFF-center) ramifying types, measurement of tracer coupling resulted in a preferentially homologous occurrence among cells of the same morphological type (n = 19 of 24). In high-voltage as well as conventional electron microscopic analysis, direct dendrodendritic gap junctions (average size, 0.86 mum long) were present in contact sites between tracer-coupled alpha-cells. In simultaneous dual whole-cell recordings from pairs of neighboring alpha-cells, these cells generated TTX-sensitive sustained spiking against extrinsic current injection, and bidirectional electrical synapses (maximum coupling coefficient, 0.32) with symmetrical junction conductance (average, 1.35 nS) were observed in pairs with cells of the same morphological type. Precise temporal synchronization of spike activity (average time delay, 2.7 msec) was detected when depolarizing currents were simultaneously injected into the pairs. To address whether physiologically identified electrical synapses constitute gap junctional connectivity between cell pairs, identified neuronal connexin36 immunoreactivity was undertaken in Lucifer yellow-labeled cell pairs after patch-clamp recordings. All alpha-cells expressed connexin36, and confocal laser-scanning imaging demonstrated that connexin36 is primarily located at dendritic crossings between electrically coupled cells (seven sites in a pair, on average). These results give conclusive evidence for electrical synapses via dendrodendritic gap junctions involving connexin36 in alpha retinal ganglion cells of the same physiological type.


Figures

Figure 1.
Figure 1.
Spikes and tracer coupling of a rat α-GC. A, Top, Action potentials elicited by depolarizing constant-current injection through a recording pipette (90 pA). Bottom, Voltage responses generated by hyperpolarizing current injection (-200 pA). Command current episodes used in the experiment are indicated between the voltage traces from a holding potential of -70 mV. B, Cellular morphology and tracer-coupling pattern for an inner-type α-GC, revealed by intracellular injection of Neurobiotin after patch-clamp recordings of their responses shown in A. When the central cell has been injected with Neurobiotin, it was coupled to a halo of other α-GCs. α-GCs are homotypically distributed in a regular hexagonal array. Note that Neurobiotin has not spread to any amacrine cells in this preparation. Each coupled cell soma is localized within the dendritic tree of another cell. Dendritic contacts occur between peripheral processes of coupled cells in the proximal part (sublamina b) of the IPL. The arrow indicates the axon of the injected α-cell. Scale bar, 100 μm.
Figure 2.
Figure 2.
Electron micrographs showing the dendrodendritic gap junctions between Neurobiotin-coupled neighboring α-GCs, revealed by high-voltage (A, B) and conventional (C) electron microscopy. A, The direct junctional contact (arrows) occurs between the tips of peripheral dendrites from coupled inner-type α-GCs. The specimen was observed at 1000 kV in a tangential 5-μm-thick section. B, Labeled dendrites make another direct contact with each other at dendritic tips in a tip-to-shank manner. Note the close apposition of the labeled dendrites of the two contacting cells as demarcated by arrows. C, High-magnification view of a gap junction formed between two labeled peripheral dendrites from coupled cells by conventional electron microscopy of an ultrathin section at 75 kV. Plasma membranes of the two labeled dendrites are closely apposed with a narrow central gap, 2.7 nm wide, between the outer leaflets of the apposed unit membranes. Scale bars: A, B, 10 μm; C, 200 nm.
Figure 3.
Figure 3.
Bidirectional electrical synapses between α-GCs of the same type, revealed by simultaneous dual patch-clamp recordings. A1, A2, Spikes of two cells (cells 1 and 2) elicited by depolarizing constant-current injection through recording pipettes from a holding potential of -70 mV. A3, Fluorescence photomicrograph of the pair of outer-type α-GCs in a whole-mount preparation after filling with LY. Scale bar, 100 μm. B, With the pair of two neighboring cells incurrent-clamp condition under dual recordings, 200 msec current pulses (I1)of -50 and +50 pA are applied to cell 1 while voltage responses are recorded from both cells (V1 and V2) in the presence of pharmacological blockers of chemical synaptic transmission (see Results). Injection of negative current results in hyperpolarization of both cells, and injection of positive current results in depolarization of both cells. C, Same as in B, but the current pulses are applied to cell 2. D, Summary of coupling coefficient between α-GCs. Comparison of coupling coefficient in each direction shows apparent rectification for some cell pairs, when electrical transmission in the same cell pair was examined in both directions (e.g., cell 1 is first presynaptic, and cell 2 is then presynaptic). The dashed line indicates the values expected when the coupling coefficient is the same in both directions for pairs of α-GCs.
Figure 4.
Figure 4.
Measurement of electrical junction conductance (Gj) between α-GCs. A, With both cells in whole-cell voltage clamp (V1 and V2), voltage steps (-90 to -50 mV, 10 mV increments) from a holding potential of -60 mV were applied to one cell (V1), and current responses were recorded in both cells (I1 and I2). B, Current-voltage relationship between the junctional current (Ij) and the junctional voltage (Vj) shown in A. The plotted data are fit with a straight line, the slope of which shows Gj. C, Summary of Gj. Comparison of Gj in each direction shows nonrectifing electrical synapses, when electrical coupling in the same cell pair was examined in both directions [e.g., Gj (cell 1 to cell 2) for cell 1 presynaptic, and Gj (cell 2 to cell 1) for cell 2 presynaptic]. The dashed line indicates the values expected when Gjis the same in both directions for pairs of α-GCs.
Figure 5.
Figure 5.
Synchronized spiking in α-GCs of the same type. A, B, Simultaneous membrane voltage responses were recorded from a pair of inner-type α-GCs under simultaneous application of depolarizing current injection through dual recording pipettes, after blocking chemical synaptic transmission pharmacologically (see Materials and Methods). The two simultaneously recorded cells (A, cell 1; B, cell 2) generated synchronization of spikes (asterisks) within a time delay of 4.4 msec. Action potentials in one cell produced transient depolarizations in the other cell (arrows). These cases would be when spikes in one cell were raised with a time delay of over 1.5 msec after generation of spikes in the other cell. C, D, Membrane voltage responses of the two cells in more detail.
Figure 6.
Figure 6.
Expression and localization of gap junction channel Cx36 in COS-7 cells and neuronal tissue. Antisera recognizing Cx36 channels was raised, using the predicted sequence of rat retinal Cx36 protein, the nucleotide sequence of which is available from GenBank/EMBL under accession number AJ296282. A, Western blot analysis of proteins from COS-7 cells and rat tissue homogenates (10 μg), probed with affinity-purified anti-Cx36 antisera (see Results). The profiles show a single immunoreactive band with an apparent molecular mass of 36 kDa (arrowhead) in pcD-Cx36-transfected COS-7 cells (COS, pcD; lane 2), whereas in COS-7 wild type the band was not seen (COS, Cont; lane 1). A single 36 kDa band was seen in adult rat retina (Rt, Ad; lane 3), olfactory bulb (OB, Ad; lane 4), and P0 developing cerebral neocortex (CC, P0; lane 6). A faint signal was detected in the hippocampus (Hipp, Ad; lane 5) and the neocortex (CC, Ad; lane 7) of adult animals. No labeling in the heart (lane 8) was seen. The molecular mass is indicated on the left. B, C, Punctate immunofluorescence pattern of Cx36 expression on contacting membrane between cultured pcD-Cx36-transfected clones, stained by anti-Cx36 antisera (C), whereas no immunoreactivity in COS-7 wild type (B) is shown. D, E, The formation of functional intercellular channels in pcD-Cx36-transfected COS-7 cells, revealed with intracellular injection of LY. The dye diffused into five neighboring cells (arrows) from the injected cell among pcD-Cx36-transfected clones(E), whereas nodyecoupling in wildtype (D) was shown. Scale bar: (in C) 50 μm.
Figure 7.
Figure 7.
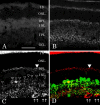
Confocal optical images of immunofluorescent labeling of rat retina with anti-Cx36 antisera. A, Control section. B, Acetone exposure. A retinal section incubated with anti-Cx36 antibody shows punctate immunofluorescence throughout the IPL. Any intracellular labeling is not observed throughout the retina. Note the absence of puncta in the OPL. C, Paraformaldehyde-based fixation. Discrete punctate signals are seen throughout the OPL (filled arrowhead) as well as the IPL, and cytoplasmic immunolabeling of somata (open arrowheads) in the conventional amacrine cell layer and the GCL (large perikarya; indicated by double arrows) is shown. The puncta of the IPL are equivalent between paraformaldehyde-fixed and acetone-exposed retinas (B). In the OPL, relatively large and brilliant puncta are visible. D, The immunoreactivity against Cx36 (red) and parvalbumin (green) was merged in a single image by double labeling of the same section as C. Perikaryal immunoreactivity (indicated by open arrowheads in C) demonstrates colocalization with the diffuse parvalbumin immunolabeling (yellow). IS, Inner segments of photoreceptor cells; ONL, outer nuclear layer. Scale bar: (in A) 50 μm.
Figure 8.
Figure 8.
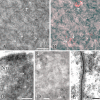
Cx36 is localized both in cytoplasmic vesicular structures and gap junctions. A, B, Laser-scanning images of cytoplasmic Cx36 immunofluorescence localized in large somata in the GCL. Intracellular immunoreactivity (red) is localized in vesicular structures within large somata in the GCL. In B, the immunoreactivity (red) was merged in a bright-field image of the GCL. Note that localization of cytoplasmic immunofluorescence is restricted to the perinuclear region. Perikaryal immunoreactivity corresponds to the vesicles (arrows) shown in A. C, Immunoelectron micrograph demonstrating subcellular distribution of perikaryal vesicular immunoreactivity within a large soma in the GCL, observed at 1000 kV by high-voltage electron microscopy of a 5-μm-thick section. Cytoplasmic immunoreactivity is, in particular, associated with a vesicular structure (arrow) in the perinuclear region. Nu, Cell nucleus. D, Low-power magnification by high-voltage immunoelectron microscopy of the IPL shows representative areas of immunopositive junctional contacts (arrows). E, Immunoelectron micrograph demonstrating gap junction plaques formed at sites of intercellular contact in the IPL of an ultrathin section. Plasma membranes of the two processes are closely apposed with a narrow central gap, 2.7 nm wide, between the outer leaflets of the apposed unit membranes. Scale bars: A, B, 20 μm; C, D, 2 μm; E, 100 nm.
Figure 9.
Figure 9.
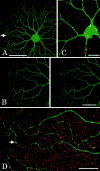
α-GCs express Cx36. A, A projected image of LY labeling of inner-type α-GCs indicates its dendritic expansion that involves self-contacts between peripheral dendrites (arrow). B, Stereo pair demonstrating their dendrites, shown in A. Note that self-contacting dendrites (arrow) are protruded to more distal layers of the IPL, apart from the proximal plane contributing to the main dendritic distribution of the cell. C, Vesicular immunoreactivity is localized in the cytoplasm of soma and primary dendrites. The immunoreactivity (red) was merged in LY labeling (green). Note that localization of perikaryal immunolabeling is restricted to the perinuclear region. D, Punctate immunoreactivity is localized along peripheral dendrites. An immunopunctum is localized at the site for self-contacts between dendritic terminals (arrow), which shows the presence of gap junctions at the contact. Scale bars: A, 100 μm; B, 50 μm; C, D, 20 μm.
Figure 10.
Figure 10.
Gap junctions involving Cx36 are localized in dendrodendritic contacts between electrically coupled α-GCs. A, A confocal projected image demonstrating LY labeling of a pair of electrically coupled outer-type α-GCs. This cell pair showed bidirectional electrical synapses by dual recordings. B, C, High-power magnification of the enlargement of the framed area in A, demonstrating dendritic interconnections between the two cells (green) with localization of Cx36 immunoreactivity (red). The cells make 10 dendrodendritic contacts with one another, all of which are indicated by arrows or arrowheads. The contact site is present either at the dendritic tip or mutual crossing point. Note that seven contact sites localize immunopuncta (yellow; indicated by filled arrows), whereas three sites show no immunoreactivity (open arrowheads). D-H, High-magnification views of single confocal optical images of the six contact sites designated in B and C, demonstrating that each direct contact between the dendrites contain a Cx36 punctum (yellow). I-M, A focal series of single confocal optical images of the dendritic contact designated in C shows that the Cx36 punctate signal (yellow) occurs only where the two α-GC dendrites actually touch each other in the three-dimensional space. Scale bars: A, 50 μm; B, C, 20 μm; D-M, 5 μm.

Similar articles

Cited by

References

    1. Adams JC (1981) Heavy metal intensification of DAB-based HRP reaction product. J Histochem Cytochem 29: 775. - PubMed
    1. Al-Ubaidi MR, White TW, Ripps H, Poras I, Avner P, Gomes D, Bruzzone R (2000) Functional properties, developmental regulation, and chromosomal localization of murine connexin36, a gap-junctional protein expressed preferentially in retina and brain. J Neurosci Res 59: 813-826. - PubMed
    1. Amitai Y, Gibson JR, Beierlein M, Patrick SL, Ho AM, Connors BW, Golomb D (2002) The spatial dimensions of electrically coupled networks of interneurons in the neocortex. J Neurosci 22: 4142-4152. - PMC - PubMed
    1. Barlow HB, Fitzhugh R, Kuffler SW (1957) Change of organization in the receptive fields of the cat's retina during dark adaptation. J Physiol (Lond) 137: 338-354. - PMC - PubMed
    1. Belluardo N, Mudo G, Trovato-Salinaro A, Le Gurun S, Charollais A, Beinier V, Amato G, Haefliger JA, Meda P, Condorelli DF (2000) Expression of connexin36 in the adult and developing rat brain. Brain Res 865: 121-138. - PubMed

Publication types

MeSH terms

LinkOut - more resources