. 2004 Dec;16(12):3304-25.
doi: 10.1105/tpc.104.025973. Epub 2004 Nov 17.

A Robot-based platform to measure multiple enzyme activities in Arabidopsis using a set of cycling assays: comparison of changes of enzyme activities and transcript levels during diurnal cycles and in prolonged darkness

Affiliations

A Robot-based platform to measure multiple enzyme activities in Arabidopsis using a set of cycling assays: comparison of changes of enzyme activities and transcript levels during diurnal cycles and in prolonged darkness

Yves Gibon et al. Plant Cell. 2004 Dec.

Abstract

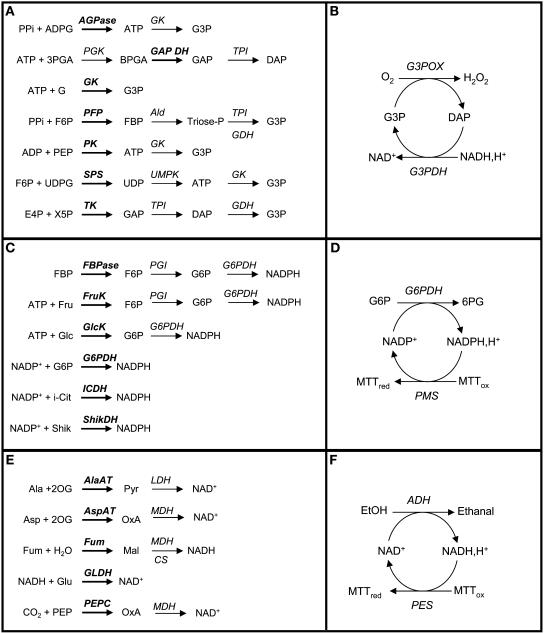
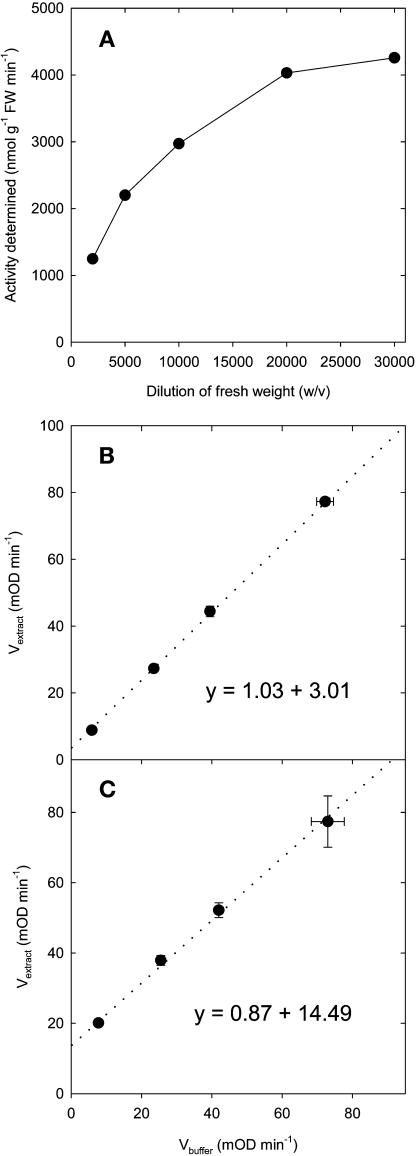
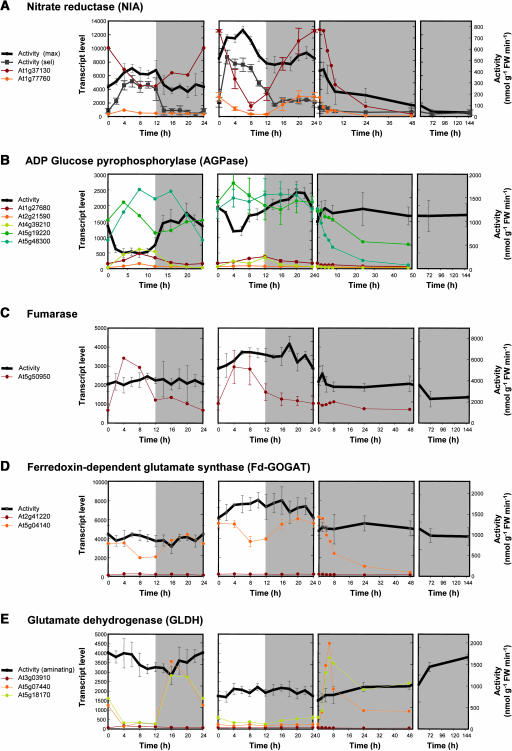
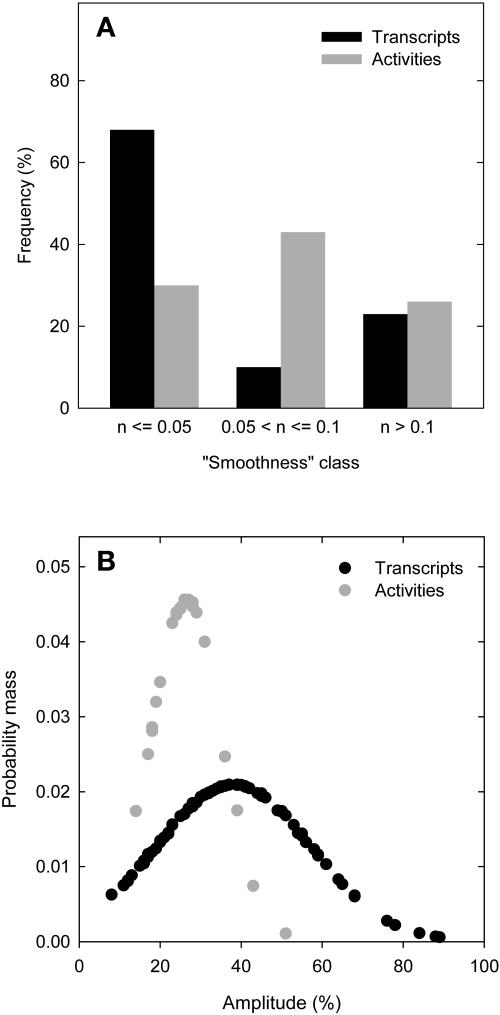
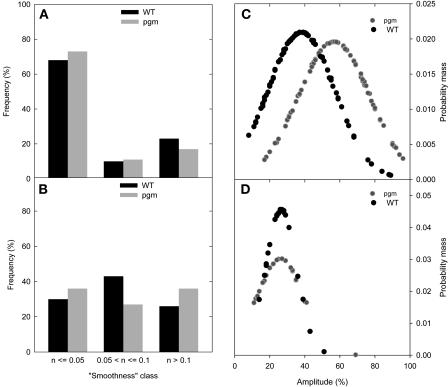
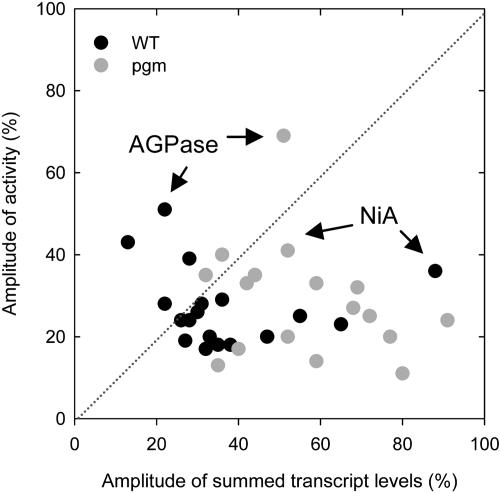
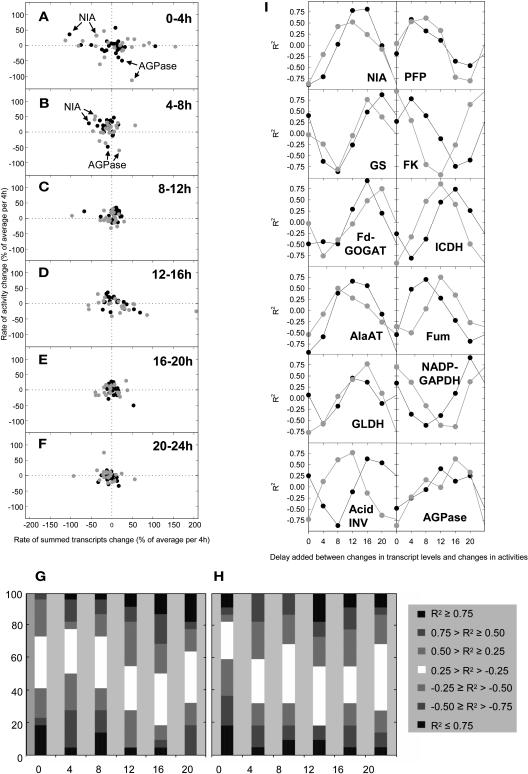
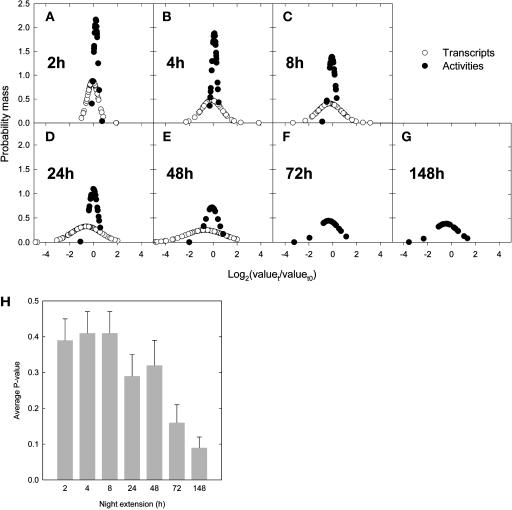
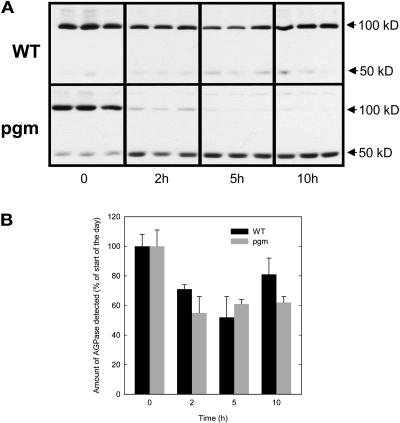
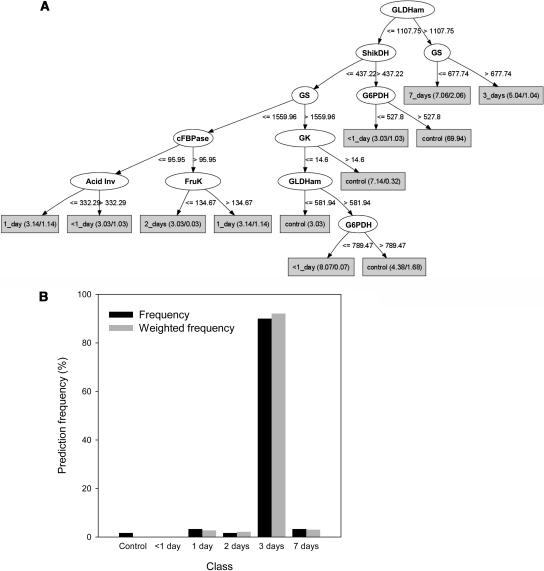
A platform has been developed to measure the activity of 23 enzymes that are involved in central carbon and nitrogen metabolism in Arabidopsis thaliana. Activities are assayed in optimized stopped assays and the product then determined using a suite of enzyme cycling assays. The platform requires inexpensive equipment, is organized in a modular manner to optimize logistics, calculates results automatically, combines high sensitivity with throughput, can be robotized, and has a throughput of three to four activities in 100 samples per person/day. Several of the assays, including those for sucrose phosphate synthase, ADP glucose pyrophosphorylase (AGPase), ferredoxin-dependent glutamate synthase, glycerokinase, and shikimate dehydrogenase, provide large advantages over previous approaches. This platform was used to analyze the diurnal changes of enzyme activities in wild-type Columbia-0 (Col-0) and the starchless plastid phosphoglucomutase (pgm) mutant, and in Col-0 during a prolongation of the night. The changes of enzyme activities were compared with the changes of transcript levels determined with the Affymetrix ATH1 array. Changes of transcript levels typically led to strongly damped changes of enzyme activity. There was no relation between the amplitudes of the diurnal changes of transcript and enzyme activity. The largest diurnal changes in activity were found for AGPase and nitrate reductase. Examination of the data and comparison with the literature indicated that these are mainly because of posttranslational regulation. The changes of enzyme activity are also strongly delayed, with the delay varying from enzyme to enzyme. It is proposed that enzyme activities provide a quasi-stable integration of regulation at several levels and provide useful data for the characterization and diagnosis of different physiological states. As an illustration, a decision tree constructed using data from Col-0 during diurnal changes and a prolonged dark treatment was used to show that, irrespective of the time of harvest during the diurnal cycle, the pgm mutant resembles a wild-type plant that has been exposed to a 3 d prolongation of the night.


Figures

Figure 1.
Figure 1.
Principles of Stopped Assays for Enzyme Activities That Use a Cycling Assay to Determine the Product of the Reaction. (A) and (B) Determinations based on the glycerol-3P-cycling assay. (C) and (D) Determinations based on the NADP-cycling assay. (E) and (F) Determinations based on the NAD-cycling assay. (A), (C), and (E) represent the stopped step leading to glycerol-3P or dihydroxyacetone-P, NADPH, or NAD(H), respectively, directly or via coupled reactions. The enzyme measured is in bold. For clarity, products that are not measured have been omitted as well as the cosubstrates required for the coupling reactions. (B), (D), and (F) represent the principles of the cycling reactions for the determination of glycerol-3P or dihydroxyacetone-P, NADP(H), or NAD(H), respectively. AGPase, glucose-1-phosphate adenyltransferase; Ald, aldolase; AlaAT, Ala aminotransferase; AspAT, Asp aminotransferase; CS, citrate synthase; FBPase, fructose-1,6-bisphosphatase; FruK, fructokinase; Fum, fumarase; G3PDH, glycerol-3P dehydrogenase; G3POX, glycerol-3P oxidase; G6PDH, glucose-6P dehydrogenase; GlcK, glucokinase; GAP DH, glyceraldehyde-3P dehydrogenase; GK, glycerokinase; GLDH, glutamate dehydrogenase; ICDH, isocitrate dehydrogenase; LDH, lactate dehydrogenase; MDH, malate dehydrogenase; PEPC, phosphoenolpyruvate carboxylase; PFP, pyrophosphate-dependent phosphofructokinase; PGI, phosphoglucose isomerase; PGK, phosphoglycerate kinase; PK, pyruvate kinase; ShikDH, shikimate dehydrogenase; SPS, sucrose-phosphate synthase; TPI, triose-P isomerase; UMPK, UMP kinase. Abbreviations for chemicals are as follows: 2OG, 2-oxoglutarate; 3PGA, 3-phosphoglycerate; 6PG, 6-phosphogluconate; ADPG, adenine-diphosphoglucose; BPGA, bisphosphoglycerate; DAP, dihydroxyacetone-P; F6P, fructose-6P; FBP, fructose-1,6-bisP; Fum, fumarate; G, glycerol; G3P, glycerol-3P; GAP, glyceraldehyde-3P; i-Cit, isocitrate; Mal, malate; MTT, methylthiazolyldiphenyl-tetrazolium bromide; OxA, oxaloacetate; PEP, phosphoenol pyruvate; Pyr, pyruvate; Shik, shikimate.
Figure 2.
Figure 2.
Validation of the Assay for Fumarase. (A) Relation between the dilution of the extract and the apparent activity determined. Dilutions were made with the extraction buffer before the assay. (B) and (C) Recovery of malate standards (0, 0.1, 0.2, and 0.5 nmol) from Arabidopsis rosette extracts set to a 20,000-fold dilution of FW (w/v). The slope of the lines gives the fraction of malate recovered. Data are given in mOD min−1 ± sd (n = 3).
Figure 3.
Figure 3.
Changes of Enzyme Activity and Transcript Levels for Each Member of the Corresponding Gene Family in 5-Week-Old Arabidopsis Col-0 Wild-Type and pgm Rosettes throughout a Night and Day Cycle (12 h/12 h) and Wild-Type Rosettes after a Transfer to Continuous Darkness. (A) Nitrate reductase. (B) ADP-glucose pyrophosphorylase. (C) Fumarase. (D) Ferredoxin-dependent glutamate synthase. (E) Glutamate dehydrogenase. The diurnal cycle in wild-type Col-0 is shown in the second panel from left, the diurnal cycle in pgm is shown in the first panel from left, and the extended night in panels 3 and 4 from left. Enzyme activities are expressed as nmol g−1 FW min−1 ± sd (n = 5). For NIA, maximal (max) and selective (sel) activities are given. Transcript levels are expressed as robust multichip average–normalized signals ±sd (n = 3; wild type only).
Figure 4.
Figure 4.
Evaluation of the Periodic Variation for 84 Transcript Levels and the Corresponding 23 Enzyme Activities and Distribution of Their Amplitudes in Arabidopsis Col-0 Wild Type. (A) Smoothness classes for transcripts (black bars) and activities (gray bars). (B) Probability mass function of amplitudes for transcripts (black circles) and activities (gray circles). The calculation of the smoothness classes and the probability mass function is presented in Methods.
Figure 5.
Figure 5.
Comparison between Arabidopsis Col-0 Wild Type and pgm of the Periodic Variation for 84 Transcript Levels and the Corresponding 23 Enzyme Activities and for the Distribution of Their Amplitudes. (A) Smoothness classes for transcripts levels. (B) Smoothness classes for activities calculated after smoothing. (C) and (D) Probability mass function of the amplitudes of transcripts levels (C) and activities (D).
Figure 6.
Figure 6.
Comparison of the Amplitude of the Diurnal Changes of Transcripts and the Amplitudes of the Diurnal Changes of Enzyme Activities in Arabidopsis Col-0 Wild Type and pgm. The results are calculated from the data in Figure 3 and the supplemental data online using the equation given in the text. Data for AspAT, G6PDH, PK, and SPS are omitted. The data points corresponding to AGPase and NIA are identified with arrows.
Figure 7.
Figure 7.
Global Overview of the Time Lag of Changes of Enzyme Activities Compared with Transcript Levels in Arabidopsis Col-0 Wild Type and pgm Plants. (A) to (F) The normalized changes of summed transcripts levels and enzyme activities were estimated for each 4 h. The changes of transcript levels were plotted against the change of enzyme levels in the same time interval (wild type, black circles; pgm, gray circles) and in an interval 4, 8, 12, 16, and 20 h later and the correlation coefficients calculated for each enzyme. This was repeated for each of the six time intervals. (G) and (H) The regression coefficients for a given time delay were combined across all six time intervals and 23 enzymes and are depicted divided into seven classes (R2 ≥ 0.75; 0.50 ≤ R2 < 0.75; 0.25 ≤ R2 < 0.50; −0.25 < R2 < 0.25; −0.50 < R2 ≤ −0.25; −0.75 < R2 ≤ −0.50; R2 ≤ −0.75) for the wild type (G) and pgm (H). (I) Time lag of the response of individual enzyme activities in wild-type (black circles) and pgm (gray circles) plants. Regression coefficients were estimated ([G] and [H]) and are plotted here for 10 selected enzymes. Each point represents the regression coefficients, calculated over six time points from a plot of the change of transcript against the change of enzyme activity after a given delay (x axis) for each of the six 4-h time intervals. Abbreviations are given in Figure 1.
Figure 8.
Figure 8.
Comparison of the Changes in Transcript Levels with the Changes in Enzyme Activities after 2, 4, 8, 24, 48, 72, and 148 h after a Transfer to a Prolonged Night. For each analyte, the ratios between values at t and t0 (start of the experiment) were first calculated, then converted to their basis 2 logarithm to approach the normal distribution, and the probability mass was calculated for transcripts and activities after 2 (A), 4 (B), 8 (C), 24 (D), 48 (E), 72 (F), and 148 h (G). Open circles, changes in transcript levels; closed circles, changes in enzyme activities. Transcript levels were not determined at 72 and 148 h of extended night. Significance of the changes in enzyme activities was also estimated by calculating the average P values at each point (H), obtained by calculating P values for every activity, using the t test (t0, t, two tails, and heteroscedastic). Bars = means ± se (n = 23).
Figure 9.
Figure 9.
Immunological Detection of AGPB Protein in Nonreducing Denaturing Gels. Proteins were extracted from rosettes of the wild type and pgm collected at 0 (end of the night), 2, 5, and 10 h of day. Protein gel blots (A) and relative amounts of AGPB (B) calculated as the sum of monomer (50 kD) and dimer (100 kD). Levels are given as a percentage of the respective levels determined for the wild type and pgm at the end of the night ±sd (n = 3).
Figure 10.
Figure 10.
Enzyme Activities as Diagnostic Markers. (A) Six classes of wild-type samples corresponding to controls harvested throughout a normal night and day cycle or plants exposed to a prolonged night for <1, 1, 2, 3, or 7 d were used to build a decision tree that placed the sample in the correct class with a learning accuracy of 75%, which was obtained via a 15-fold cross-validation. All enzyme activities measured were used except AGPase, NAD-GAPDH, NADP-GAPDH, and NIA. (B) The decision tree was then used to classify 60 samples of pgm plants harvested at six time points throughout a night and day cycle. The y axis shows the frequency and the weighted frequency with which a sample was assigned to a particular class.

Similar articles

Cited by

References

    1. ap Rees, T., and Hill, S.A. (1994). Metabolic control analysis of plant metabolism. Plant Cell Environ. 17, 587–599.
    1. Arabidopsis Genome Initiative (2000). Analysis of the genome sequence of the flowering plant Arabidopsis thaliana. Nature 408, 796–815. - PubMed
    1. Ashour, M.B.A., Gee, S.J., and Hammock, B.D. (1987). Use of a 96-well microplate reader for measuring routine enzyme activities. Anal. Biochem. 166, 353–360. - PubMed
    1. Bergmeyer, H.U. (1987). Methods of Enzymatic Analysis. (Weinheim, Germany: VCH).
    1. Bernofsky, C., and Swan, M. (1973). Improved cycling assay for nicotinamide adenine-dinucleotide. Anal. Biochem. 53, 452–458. - PubMed

Publication types

MeSH terms