

Theory of optical spectra of photosystem II reaction centers: location of the triplet state and the identity of the primary electron donor
- PMID: 15556979
- PMCID: PMC1305170
- DOI: 10.1529/biophysj.104.050294
Theory of optical spectra of photosystem II reaction centers: location of the triplet state and the identity of the primary electron donor
Abstract
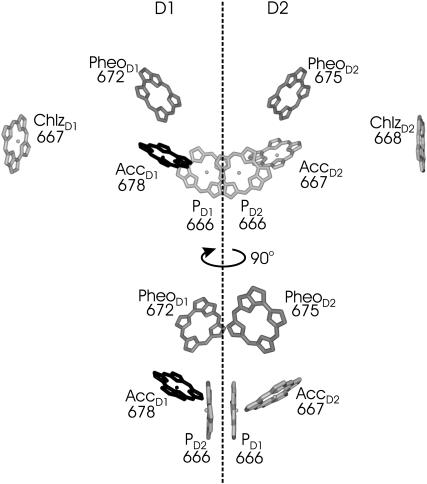
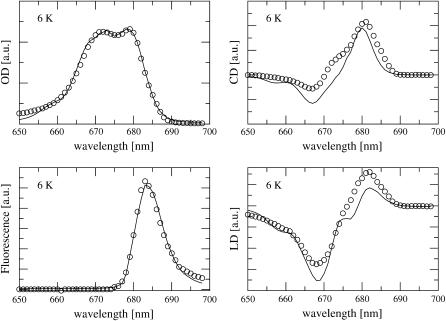
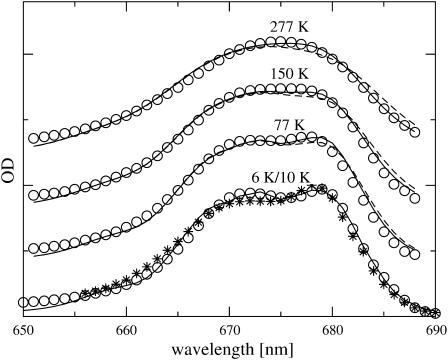
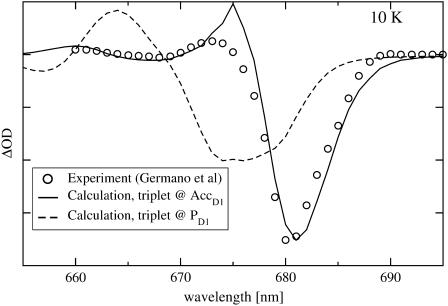
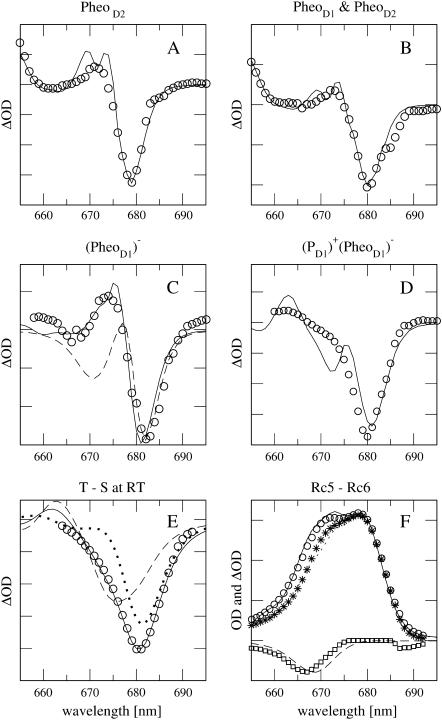
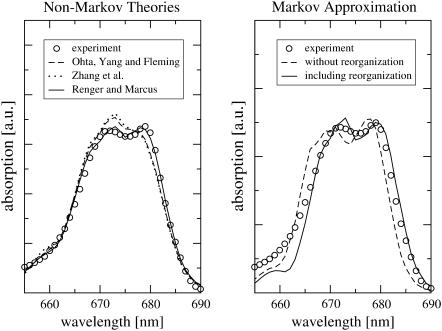
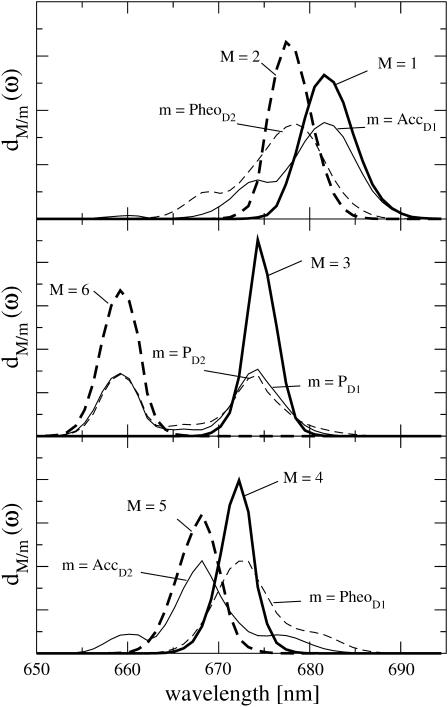
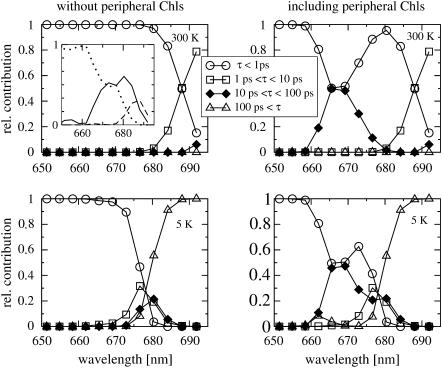
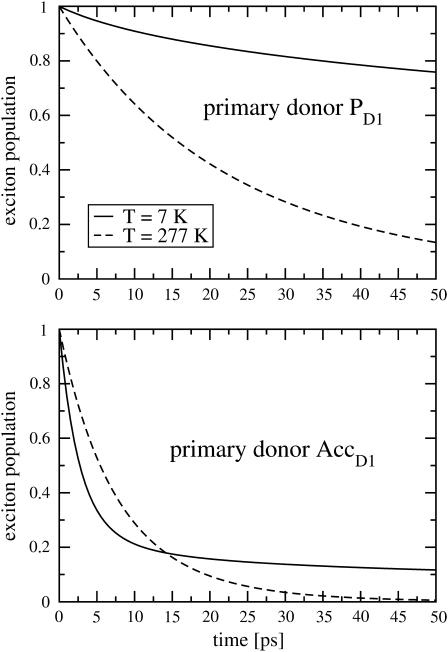
Based on the structural analysis of photosystem II of Thermosynechococcus elongatus, a detailed calculation of optical properties of reaction-center (D1-D2) complexes is presented applying a theory developed previously. The calculations of absorption, linear dichroism, circular dichroism, fluorescence spectra, all at 6 K, and the temperature-dependence of the absorption spectrum are used to extract the local optical transition energies of the reaction-center pigments, the so-called site energies, from experimental data. The site energies are verified by calculations and comparison with seven additional independent experiments. Exciton relaxation and primary electron transfer in the reaction center are studied using the site energies. The calculations are used to interpret transient optical data. Evidence is provided for the accessory chlorophyll of the D1-branch as being the primary electron donor and the location of the triplet state at low temperatures.
Figures
Similar articles
-
Spectroscopic properties of reaction center pigments in photosystem II core complexes: revision of the multimer model.Biophys J. 2008 Jul;95(1):105-19. doi: 10.1529/biophysj.107.123935. Epub 2008 Mar 13. Biophys J. 2008. PMID: 18339736 Free PMC article.
-
Pathways and timescales of primary charge separation in the photosystem II reaction center as revealed by a simultaneous fit of time-resolved fluorescence and transient absorption.Biophys J. 2005 Sep;89(3):1464-81. doi: 10.1529/biophysj.105.060020. Epub 2005 Jun 24. Biophys J. 2005. PMID: 15980183 Free PMC article.
-
Light harvesting in photosystem II core complexes is limited by the transfer to the trap: can the core complex turn into a photoprotective mode?J Am Chem Soc. 2008 Apr 2;130(13):4431-46. doi: 10.1021/ja7099826. Epub 2008 Mar 8. J Am Chem Soc. 2008. PMID: 18327941
-
Optical properties, excitation energy and primary charge transfer in photosystem II: theory meets experiment.J Photochem Photobiol B. 2011 Jul-Aug;104(1-2):126-41. doi: 10.1016/j.jphotobiol.2011.03.016. Epub 2011 Apr 7. J Photochem Photobiol B. 2011. PMID: 21531572 Review.
-
Primary photophysical processes in photosystem II: bridging the gap between crystal structure and optical spectra.Chemphyschem. 2010 Apr 26;11(6):1141-53. doi: 10.1002/cphc.200900932. Chemphyschem. 2010. PMID: 20394099 Review.
Cited by
-
Efficiency of energy funneling in the photosystem II supercomplex of higher plants.Chem Sci. 2016 Jul 1;7(7):4174-4183. doi: 10.1039/c5sc04296h. Epub 2016 Feb 29. Chem Sci. 2016. PMID: 30155062 Free PMC article.
-
Dynamic protein conformations preferentially drive energy transfer along the active chain of the photosystem II reaction centre.Nat Commun. 2014 Jun 23;5:4170. doi: 10.1038/ncomms5170. Nat Commun. 2014. PMID: 24954746 Free PMC article.
-
Structural basis of light-harvesting in the photosystem II core complex.Protein Sci. 2020 May;29(5):1090-1119. doi: 10.1002/pro.3841. Epub 2020 Feb 24. Protein Sci. 2020. PMID: 32067287 Free PMC article. Review.
-
Energy-transfer and charge-separation pathways in the reaction center of photosystem II revealed by coherent two-dimensional optical spectroscopy.J Chem Phys. 2010 Nov 14;133(18):184501. doi: 10.1063/1.3493580. J Chem Phys. 2010. PMID: 21073225 Free PMC article.
-
Optimal Energy Transfer in Light-Harvesting Systems.Molecules. 2015 Aug 20;20(8):15224-72. doi: 10.3390/molecules200815224. Molecules. 2015. PMID: 26307957 Free PMC article. Review.
References
-
- Biesiadka, J., B. Loll, J. Kern, K. D. Irrgang, and A. Zouni. 2004. Crystal structure of cyanobacterial photosystem II at 3.2 Ǻ resolution: a closer look at the Mn-cluster. Phys. Chem. Chem. Phys. 6:4733–4736.
-
- Chang, J. C. 1977. Monopole effects on electronic excitation interactions between large molecules. I. Application to energy transfer in chlorophylls. J. Chem. Phys. 67:3901–3904.
-
- Creemers, T. M. H., C. A. De Caro, R. W. Visschers, R. van Grondelle, and S. Völker. 1999. Spectral hole burning and fluorescence line narrowing in subunits of the light-harvesting complex LH1 of purple bacteria. J. Phys. Chem. B. 103:9770–9776.
-
- Dekker, J. P., and R. van Grondelle. 2000. Primary charge separation in photosystem II. Photosynth. Res. 63:195–208. - PubMed
Publication types
MeSH terms
Substances
LinkOut - more resources
Full Text Sources
