

Forces during bacteriophage DNA packaging and ejection
- PMID: 15556983
- PMCID: PMC1305160
- DOI: 10.1529/biophysj.104.047134
Forces during bacteriophage DNA packaging and ejection
Erratum in
- Biophys J. 2007 Jul 15;93(2):705
Abstract
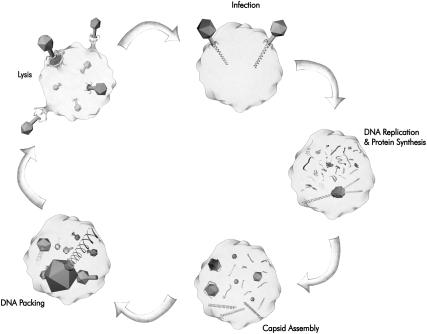
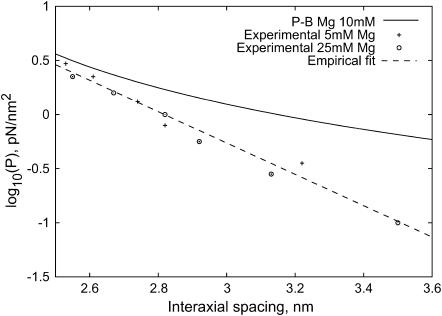
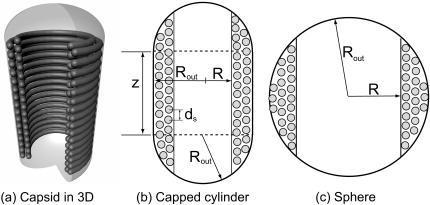
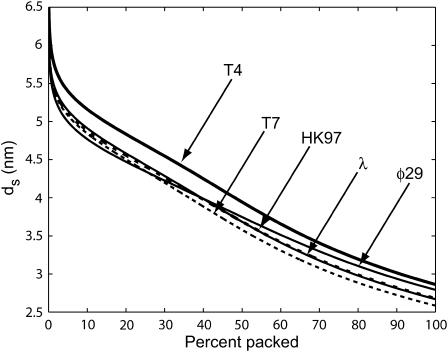
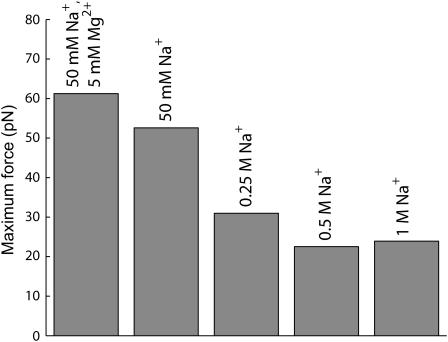
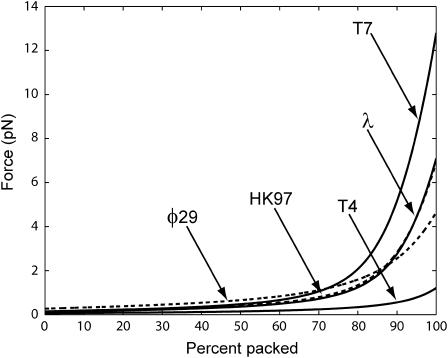
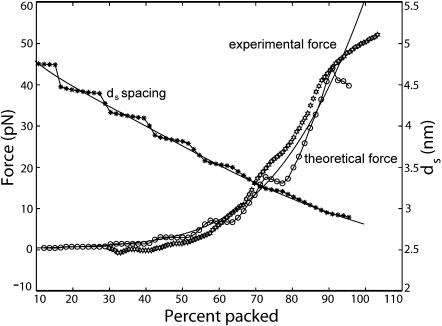
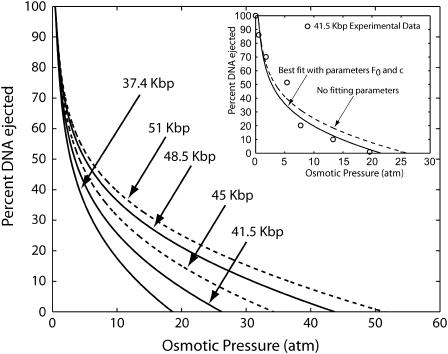
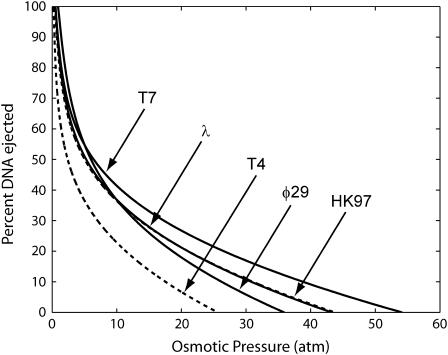
The conjunction of insights from structural biology, solution biochemistry, genetics, and single-molecule biophysics has provided a renewed impetus for the construction of quantitative models of biological processes. One area that has been a beneficiary of these experimental techniques is the study of viruses. In this article we describe how the insights obtained from such experiments can be utilized to construct physical models of processes in the viral life cycle. We focus on dsDNA bacteriophages and show that the bending elasticity of DNA and its electrostatics in solution can be combined to determine the forces experienced during packaging and ejection of the viral genome. Furthermore, we quantitatively analyze the effect of fluid viscosity and capsid expansion on the forces experienced during packaging. Finally, we present a model for DNA ejection from bacteriophages based on the hypothesis that the energy stored in the tightly packed genome within the capsid leads to its forceful ejection. The predictions of our model can be tested through experiments in vitro where DNA ejection is inhibited by the application of external osmotic pressure.
Figures
Similar articles
-
DNA ejection from bacteriophage T5: analysis of the kinetics and energetics.Biophys J. 2005 Feb;88(2):1364-70. doi: 10.1529/biophysj.104.048785. Epub 2004 Nov 12. Biophys J. 2005. PMID: 15542548 Free PMC article.
-
A kinetic analysis of DNA ejection from tailed phages revealing the prerequisite activation energy.Biophys J. 2007 Dec 1;93(11):3999-4005. doi: 10.1529/biophysj.107.111435. Epub 2007 Aug 3. Biophys J. 2007. PMID: 17675351 Free PMC article.
-
Effect of spermine and DNase on DNA release from bacteriophage T5.Eur Phys J E Soft Matter. 2005 Aug;17(4):429-34. doi: 10.1140/epje/i2005-10019-5. Epub 2005 Aug 3. Eur Phys J E Soft Matter. 2005. PMID: 16078005
-
The bacteriophage DNA packaging motor.Annu Rev Genet. 2008;42:647-81. doi: 10.1146/annurev.genet.42.110807.091545. Annu Rev Genet. 2008. PMID: 18687036 Review.
-
Packaging double-helical DNA into viral capsids: structures, forces, and energetics.Biophys J. 2008 Jul;95(2):497-502. doi: 10.1529/biophysj.108.131797. Epub 2008 May 16. Biophys J. 2008. PMID: 18487310 Free PMC article. Review.
Cited by
-
DNA ejection from an archaeal virus--a single-molecule approach.Biophys J. 2013 May 21;104(10):2264-72. doi: 10.1016/j.bpj.2013.03.061. Biophys J. 2013. PMID: 23708366 Free PMC article.
-
Popping the cork: mechanisms of phage genome ejection.Nat Rev Microbiol. 2013 Mar;11(3):194-204. doi: 10.1038/nrmicro2988. Epub 2013 Feb 4. Nat Rev Microbiol. 2013. PMID: 23385786 Review.
-
Single phage T4 DNA packaging motors exhibit large force generation, high velocity, and dynamic variability.Proc Natl Acad Sci U S A. 2007 Oct 23;104(43):16868-73. doi: 10.1073/pnas.0704008104. Epub 2007 Oct 17. Proc Natl Acad Sci U S A. 2007. PMID: 17942694 Free PMC article.
-
Pseudomonas aeruginosa as a model bacterium in antiphage defense research.FEMS Microbiol Rev. 2025 Jan 14;49:fuaf014. doi: 10.1093/femsre/fuaf014. FEMS Microbiol Rev. 2025. PMID: 40240293 Free PMC article. Review.
-
Molecular motors for DNA translocation in prokaryotes.Curr Opin Biotechnol. 2012 Aug;23(4):503-9. doi: 10.1016/j.copbio.2011.12.023. Epub 2012 Jan 7. Curr Opin Biotechnol. 2012. PMID: 22226958 Free PMC article. Review.
References
-
- Arsuaga, J., R. K. Z. Tan, M. Vazquez, D. W. Sumners, and S. C. Harvey. 2002. Investigation of viral DNA packaging using molecular mechanics models. Biophys. Chem. 101–102:475–484. - PubMed
-
- Bednar, J., P. Furrer, V. Katritch, A. Z. Stasiak, J. Dubochet, and A. Stasiak. 1995. Determination of DNA persistence length by cryo-electron microscopy. Separation of static and dynamic contributions to the apparent persistence length of DNA. J. Mol. Biol. 254:579–594. - PubMed
-
- Black, L. 1988. DNA packaging in dsDNA bacteriophage. In The Bacteriophages, Vol. 2. R. Calendar, editor. Plenum Press, New York. 321–363.
-
- Bohm, J., O. Lambert, A. Frangakis, L. Letellier, W. Baumeister, and J. Rigaud. 2001. FhuA-mediated phage genome transfer into liposomes: a cryoelectron tomography study. Curr. Biol. 11:1168–1175. - PubMed
Publication types
MeSH terms
Substances
LinkOut - more resources
Full Text Sources
