

Calcium mobilization and spontaneous transient outward current characteristics upon agonist activation of P2Y2 receptors in smooth muscle cells
- PMID: 15556987
- PMCID: PMC1305209
- DOI: 10.1529/biophysj.104.043976
Calcium mobilization and spontaneous transient outward current characteristics upon agonist activation of P2Y2 receptors in smooth muscle cells
Abstract
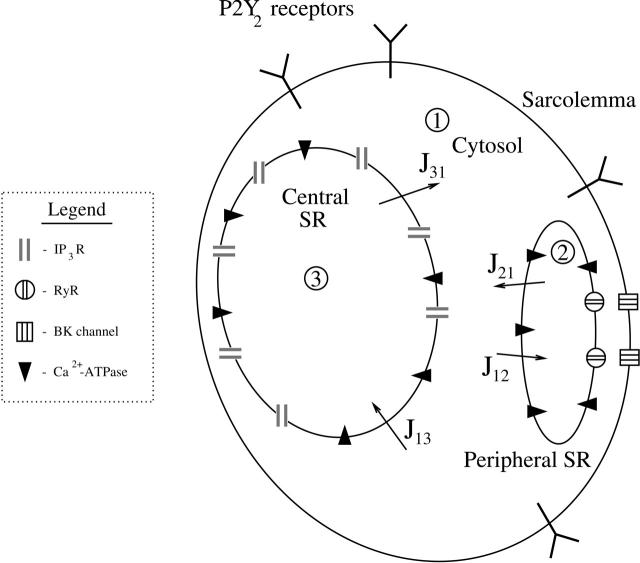
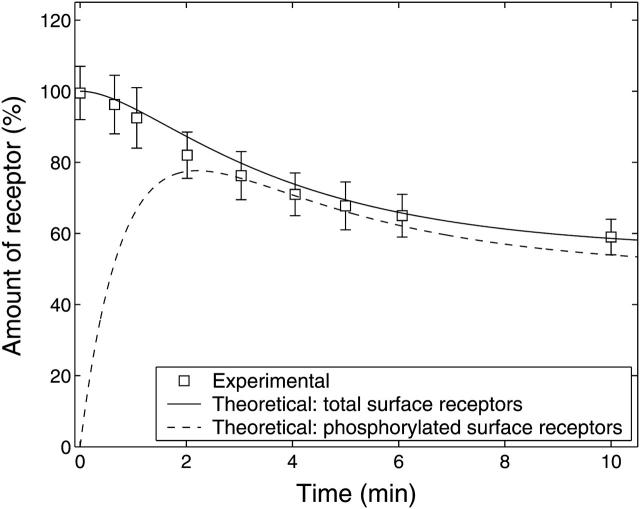
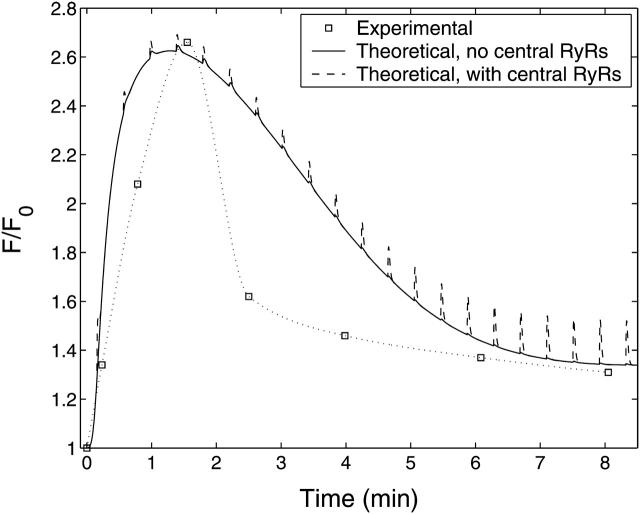
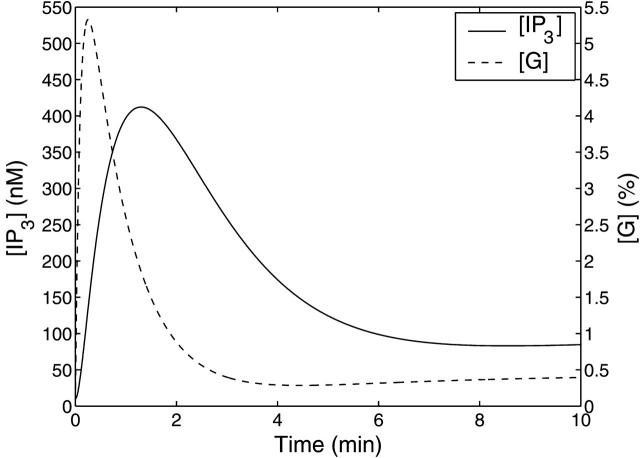
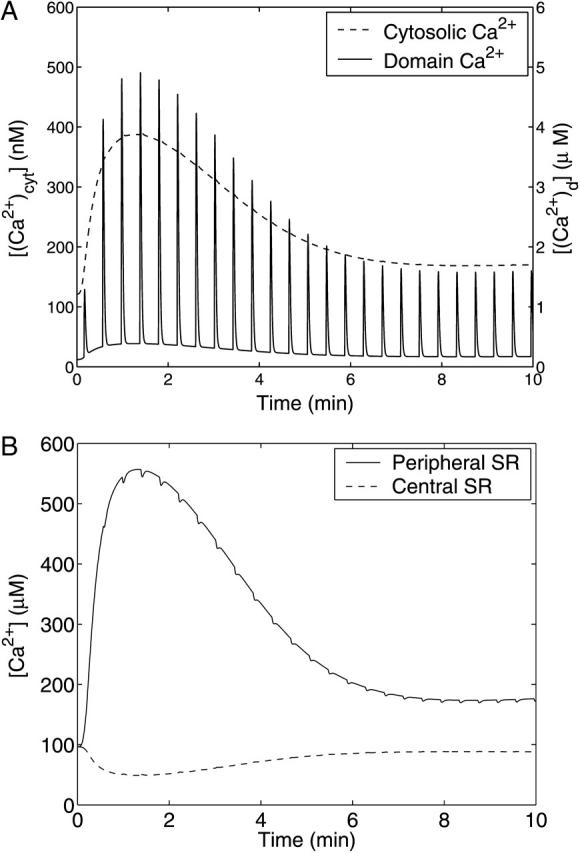
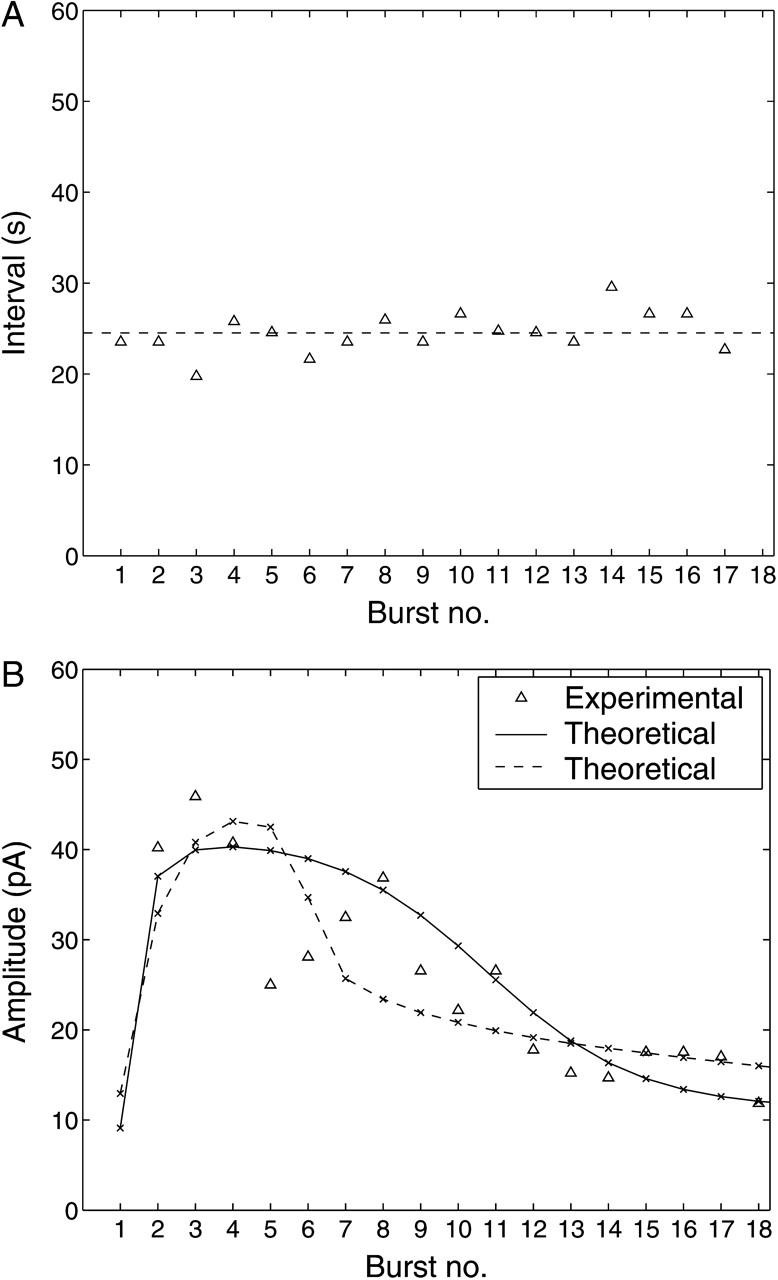
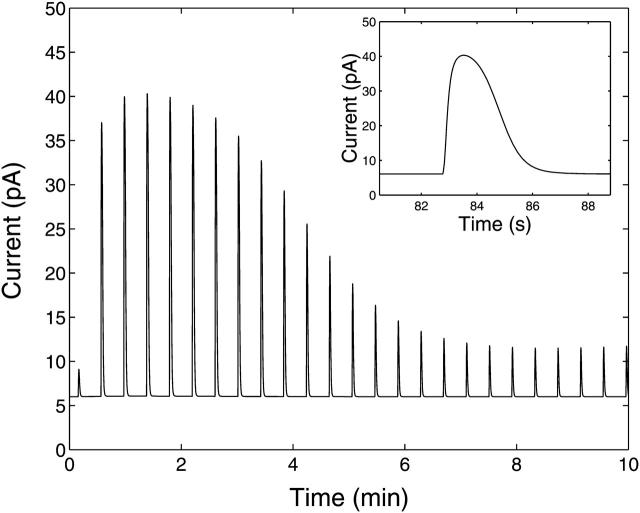
A quantitative model is provided that links the process of metabotropic receptor activation and sequestration to the generation of inositol 1,4,5-trisphosphate, the subsequent release of calcium from the central sarcoplasmic reticulum, and the consequent release of calcium from subsarcolemma sarcoplasmic reticulum that acts on large-conductance potassium channels to generate spontaneous transient outward currents (STOCs). This model is applied to the case of STOC generation in vascular A7r5 smooth muscle cells that have been transfected with a chimera of the P2Y(2) metabotropic receptor and green fluorescent protein (P2Y(2)-GFP) and exposed to the P2Y(2) receptor agonist uridine 5'-triphosphate. The extent of P2Y(2)-GFP sequestration from the membrane on exposure to uridine 5'-triphosphate, the ensuing changes in cytosolic calcium concentration, as well as the interval between STOCs that are subsequently generated, are used to determine parameter values in the model. With these values, the model gives a good quantitative prediction of the dynamic changes in STOC amplitude observed upon activation of metabotropic P2Y(2) receptors in the vascular smooth muscle cell line.
Figures


Similar articles
-
Activation of P2Y receptors stimulates potassium and cation currents in acutely isolated human Müller (glial) cells.Glia. 2002 Feb;37(2):139-52. doi: 10.1002/glia.10025. Glia. 2002. PMID: 11754212
-
Multiple P2Y receptors couple to calcium-dependent, chloride channels in smooth muscle cells of the rat pulmonary artery.Respir Res. 2005 Oct 26;6(1):124. doi: 10.1186/1465-9921-6-124. Respir Res. 2005. PMID: 16250909 Free PMC article.
-
UTP activates small-conductance Ca2+-activated K+ channels in murine detrusor PDGFRα+ cells.Am J Physiol Renal Physiol. 2015 Sep 15;309(6):F569-74. doi: 10.1152/ajprenal.00156.2015. Epub 2015 Jul 22. Am J Physiol Renal Physiol. 2015. PMID: 26202222 Free PMC article.
-
Spontaneous transient outward currents in smooth muscle cells.Cell Calcium. 1996 Aug;20(2):141-52. doi: 10.1016/s0143-4160(96)90103-7. Cell Calcium. 1996. PMID: 8889205 Review.
-
Ca2+ signalling and Ca2+-activated K+ channels in smooth muscle.Novartis Found Symp. 2002;246:52-64; discussion 64-70, 221-7. Novartis Found Symp. 2002. PMID: 12164315 Review.
Cited by
-
A mathematical analysis of agonist- and KCl-induced Ca(2+) oscillations in mouse airway smooth muscle cells.Biophys J. 2010 Apr 7;98(7):1170-81. doi: 10.1016/j.bpj.2009.12.4273. Biophys J. 2010. PMID: 20371316 Free PMC article.
-
A Ca²⁺-dependent chloride current and Ca²⁺ influx via Ca(v)1.2 ion channels play major roles in P2Y receptor-mediated pulmonary vasoconstriction.Br J Pharmacol. 2012 Jun;166(4):1503-12. doi: 10.1111/j.1476-5381.2012.01892.x. Br J Pharmacol. 2012. PMID: 22320222 Free PMC article.
-
Purinergic junctional transmission and propagation of calcium waves in cultured spinal cord microglial networks.Purinergic Signal. 2008 Mar;4(1):47-59. doi: 10.1007/s11302-007-9076-9. Epub 2007 Oct 23. Purinergic Signal. 2008. PMID: 18368533 Free PMC article.
-
Cell-type-specific modelling of intracellular calcium signalling: a urothelial cell model.J R Soc Interface. 2013 Jul 17;10(86):20130487. doi: 10.1098/rsif.2013.0487. Print 2013 Sep 6. J R Soc Interface. 2013. PMID: 23864504 Free PMC article.
-
Purinergic junctional transmission and propagation of calcium waves in spinal cord astrocyte networks.Biophys J. 2006 Nov 1;91(9):3560-71. doi: 10.1529/biophysj.106.082073. Epub 2006 Aug 11. Biophys J. 2006. PMID: 16905605 Free PMC article.
References
-
- Abbracchio, M., and G. Burnstock. 1994. Purinoceptors: are there families of P2X and P2Y purinoceptors? Pharmacol. Ther. 64:445–475. - PubMed
-
- Bringmann, A., T. Pannicke, M. Weick, B. Biedermann, S. Uhlmann, L. Kohen, P. Wiedemann, and A. Reichenbach. 2002. Activation of P2Y receptors stimulates potassium and cation currents in acutely isolated human Muller (glial) cells. Glia. 37:139–152. - PubMed
Publication types
MeSH terms
Substances
LinkOut - more resources
Full Text Sources
Molecular Biology Databases
