

Intrinsic curvature in the VP1 gene of SV40: comparison of solution and gel results
- PMID: 15556988
- PMCID: PMC1305122
- DOI: 10.1529/biophysj.104.039834
Intrinsic curvature in the VP1 gene of SV40: comparison of solution and gel results
Abstract
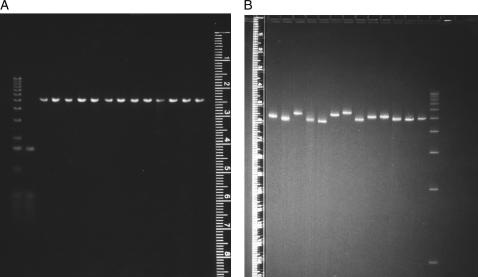
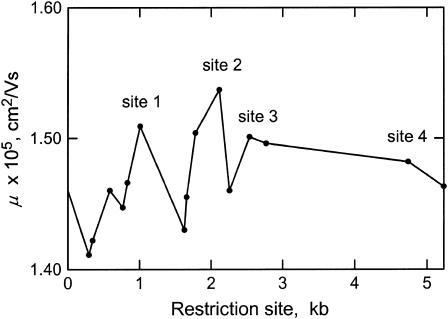
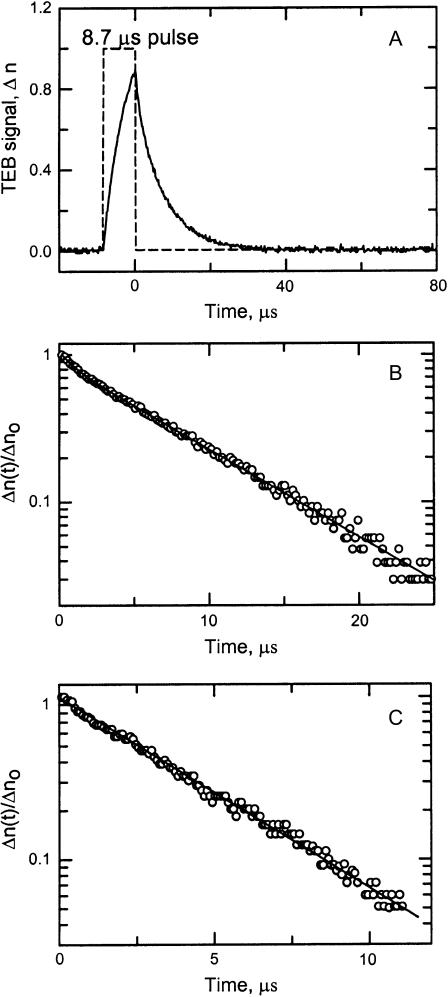
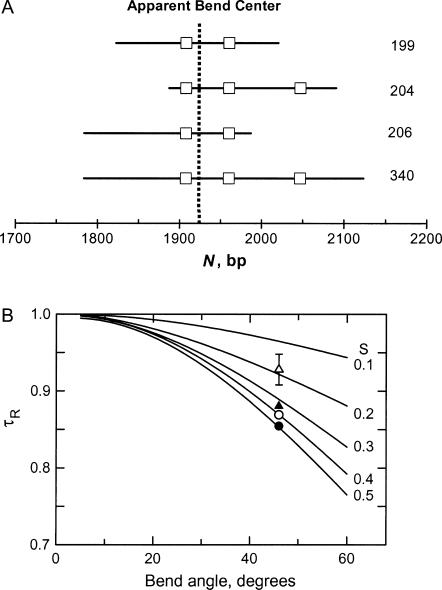
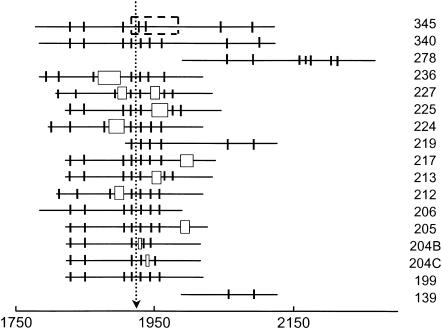
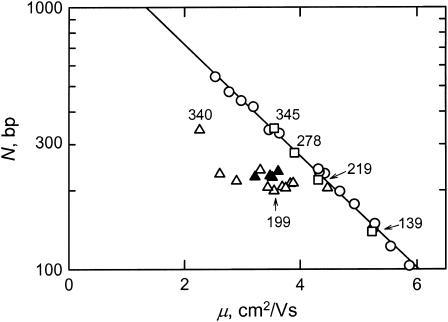
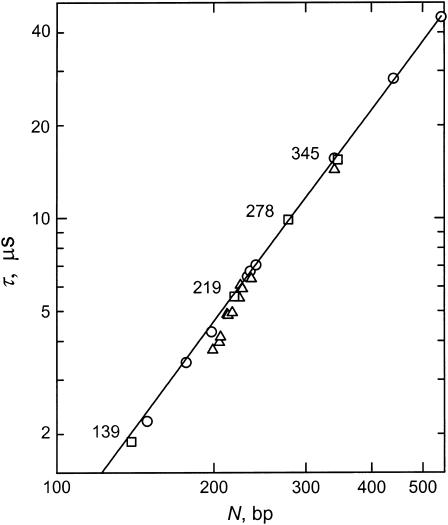
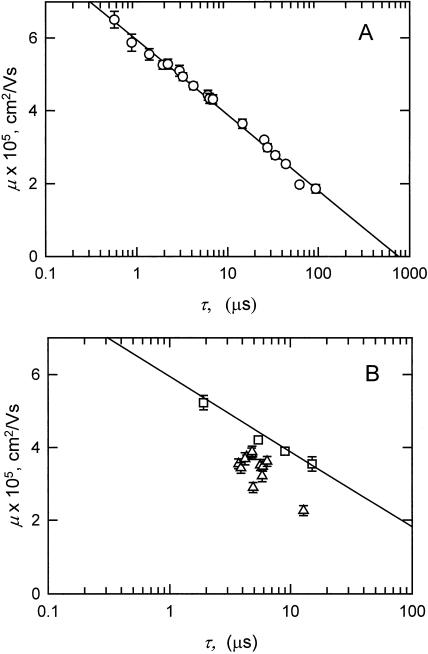
DNA restriction fragments that are stably curved are usually identified by polyacrylamide gel electrophoresis because curved fragments migrate more slowly than normal fragments containing the same number of basepairs. In free solution, curved DNA molecules can be identified by transient electric birefringence (TEB) because they exhibit rotational relaxation times that are faster than those of normal fragments of the same size. In this article, the results observed in free solution and in polyacrylamide gels are compared for a highly curved 199-basepair (bp) restriction fragment taken from the VP1 gene in Simian Virus 40 (SV40) and various sequence mutants and insertion derivatives. The TEB method of overlapping fragments was used to show that the 199-bp fragment has an apparent bend angle of 46 +/- 2 degrees centered at sequence position 1922 +/- 2 bp. Four unphased A- and T-tracts and a mixed A3T4-tract occur within a span of approximately 60 bp surrounding the apparent bend center; for brevity, this 60-bp sequence element is called a curvature module. Modifying any of the A- or T-tracts in the curvature module by site-directed mutagenesis decreases the curvature of the fragment; replacing all five A- and T-tracts by random-sequence DNA causes the 199-bp mutant to adopt a normal conformation, with normal electrophoretic mobilities and birefringence relaxation times. Hence, stable curvature in this region of the VP1 gene is due to the five unphased A- and T- tracts surrounding the apparent bend center. Discordant solution and gel results are observed when long inverted repeats are inserted within the curvature module. These insertion derivatives migrate anomalously slowly in polyacrylamide gels but have normal, highly flexible conformations in free solution. Discordant solution and gel results are not observed if the insert does not contain a long inverted repeat or if the long inverted repeat is added to the 199-bp fragment outside the curvature module. The results suggest that long inverted repeats can form hairpins or cruciforms when they are located within a region of the helix backbone that is intrinsically curved, leading to large mobility anomalies in polyacrylamide gels. Hairpin/cruciform formation is not observed in free solution, presumably because of rapid conformational exchange. Hence, DNA restriction fragments that migrate anomalously slowly in polyacrylamide gels are not necessarily stably curved in free solution.
Figures

Similar articles
-
Curved DNA molecules migrate anomalously slowly in free solution.Nucleic Acids Res. 2005 Aug 5;33(14):4425-32. doi: 10.1093/nar/gki748. Print 2005. Nucleic Acids Res. 2005. PMID: 16085753 Free PMC article.
-
Monovalent cation binding by curved DNA molecules containing variable numbers of a-tracts.Biophys J. 2008 Mar 1;94(5):1719-25. doi: 10.1529/biophysj.107.121236. Epub 2007 Nov 9. Biophys J. 2008. PMID: 17993492 Free PMC article.
-
Electrophoresis of DNA in agarose gels, polyacrylamide gels and in free solution.Electrophoresis. 2009 Jun;30 Suppl 1(Suppl 1):S188-95. doi: 10.1002/elps.200900052. Electrophoresis. 2009. PMID: 19517510 Free PMC article. Review.
-
Curved DNA molecules migrate anomalously slowly in polyacrylamide gels even at zero gel concentration.Electrophoresis. 2006 Mar;27(5-6):1163-8. doi: 10.1002/elps.200500612. Electrophoresis. 2006. PMID: 16440397
-
"Flip-flop" orientation of agarose gel fibers in pulsed alternating electric fields.Electrophoresis. 1993 Apr;14(4):355-68. doi: 10.1002/elps.1150140160. Electrophoresis. 1993. PMID: 8500468 Review.
Cited by
-
Curved DNA molecules migrate anomalously slowly in free solution.Nucleic Acids Res. 2005 Aug 5;33(14):4425-32. doi: 10.1093/nar/gki748. Print 2005. Nucleic Acids Res. 2005. PMID: 16085753 Free PMC article.
-
DNA A-tracts are not curved in solutions containing high concentrations of monovalent cations.Biochemistry. 2013 Jun 18;52(24):4138-48. doi: 10.1021/bi400118m. Epub 2013 Jun 6. Biochemistry. 2013. PMID: 23675817 Free PMC article.
-
Monovalent cation binding by curved DNA molecules containing variable numbers of a-tracts.Biophys J. 2008 Mar 1;94(5):1719-25. doi: 10.1529/biophysj.107.121236. Epub 2007 Nov 9. Biophys J. 2008. PMID: 17993492 Free PMC article.
-
Electrostatic free energy landscapes for DNA helix bending.Biophys J. 2008 Apr 15;94(8):3137-49. doi: 10.1529/biophysj.107.122366. Epub 2008 Jan 11. Biophys J. 2008. PMID: 18192348 Free PMC article.
-
Electrophoresis of DNA in agarose gels, polyacrylamide gels and in free solution.Electrophoresis. 2009 Jun;30 Suppl 1(Suppl 1):S188-95. doi: 10.1002/elps.200900052. Electrophoresis. 2009. PMID: 19517510 Free PMC article. Review.
References
-
- Allemann, R. K., and M. Egli. 1997. DNA recognition and bending. Chem. Biol. 4:643–650. - PubMed
-
- Ambrose, C., H. Lowman, A. Rajadhyaksha, V. Blasquez, and M. Bina. 1990. Location of nucleosomes in simian virus 40 chromatin. J. Mol. Biol. 214:875–884. - PubMed
-
- Bell, L., and B. Byers. 1983. Separation of branched from linear DNA by two-dimensional gel electrophoresis. Anal. Biochem. 130:527–535. - PubMed
Publication types
MeSH terms
Substances
Grants and funding
LinkOut - more resources
Full Text Sources
