. 2004 Nov 30;101(48):16745-9.
doi: 10.1073/pnas.0407752101. Epub 2004 Nov 19.

Evolution of new nonantibody proteins via iterative somatic hypermutation

Affiliations

Evolution of new nonantibody proteins via iterative somatic hypermutation

Lei Wang et al. Proc Natl Acad Sci U S A. .

Abstract

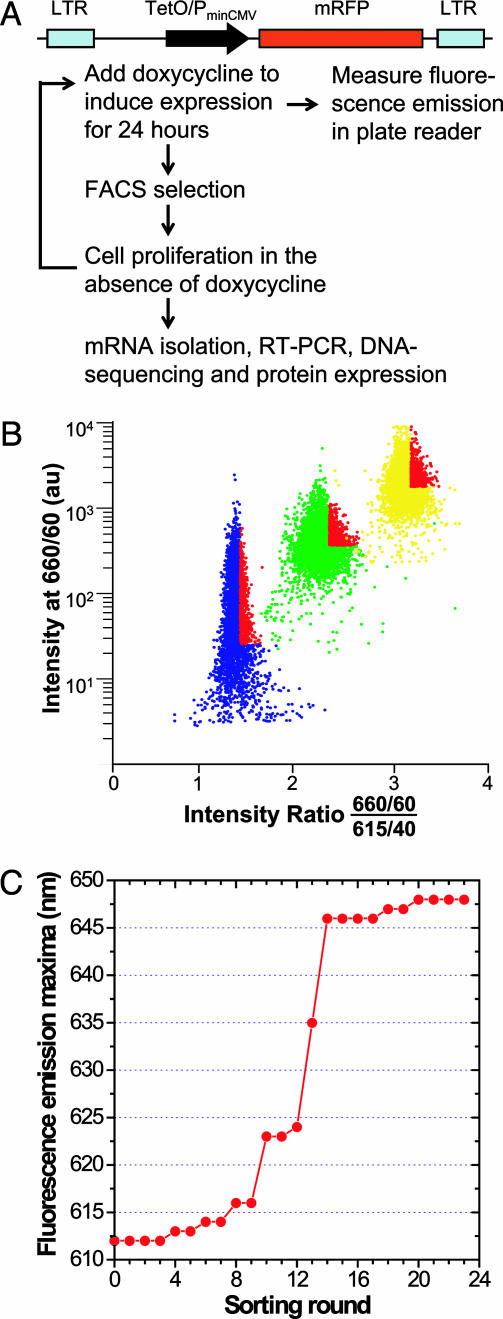
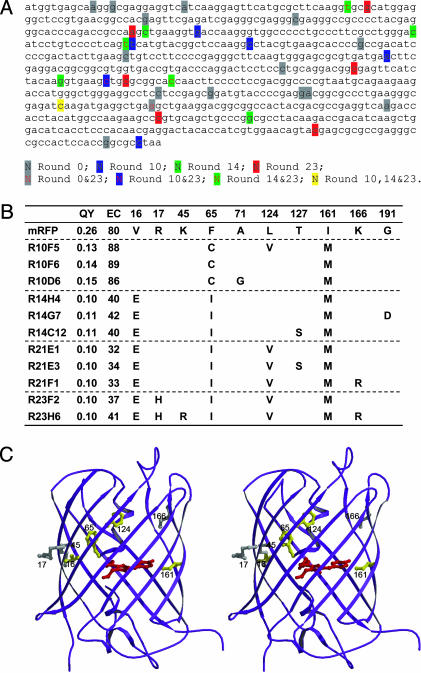
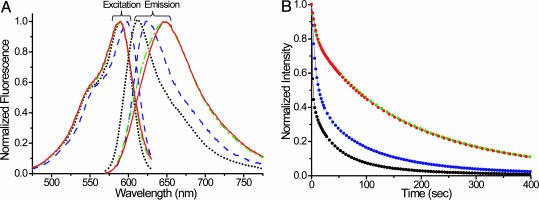
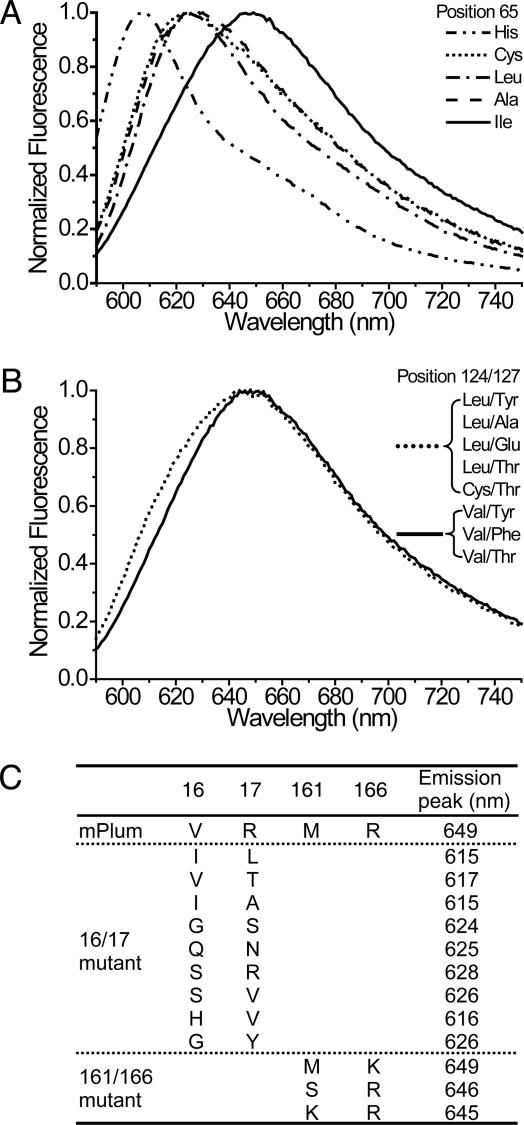
B lymphocytes use somatic hypermutation (SHM) to optimize immunoglobulins. Although SHM can rescue single point mutations deliberately introduced into nonimmunoglobulin genes, such experiments do not show whether SHM can efficiently evolve challenging novel phenotypes requiring multiple unforeseeable mutations in nonantibody proteins. We have now iterated SHM over 23 rounds of fluorescence-activated cell sorting to create monomeric red fluorescent proteins with increased photostability and far-red emissions (e.g., 649 nm), surpassing the best efforts of structure-based design. SHM offers a strategy to evolve nonantibody proteins with desirable properties for which a high-throughput selection or viable single-cell screen can be devised.


Figures

Fig. 1.
Fig. 1.
Directed evolution of mRFP with red-shifted emission by SHM in Ramos cells. (A) Schematic illustration of the construct and evolutionary process. TetO/PminCMV, Tet operator/minimal CMV promoter. (B) Typical FACS criteria for ratio sorting. Ramos cells were excited at 568 nm, and two emission filters (660/60 and 615/40) were used. The ratio of intensity at 660 nm to that at 615 nm was plotted against the intensity at 660 nm. Cells with the highest ratio and sufficient intensity at 660 nm were collected. Usually 1–2 million cells were collected each time, and they were grown in the absence of doxycycline until 24 h before the next round of FACS. Cell populations from rounds 1, 10, and 20 are shown in blue, green, and yellow, respectively. Collected cells are highlighted in red. au, Arbitrary unit. (C) Fluorescence emission maxima of the Ramos cell population in each round, measured with a spectrofluorometric plate reader (Safire, Tecan, Maennedorf, Switzerland).
Fig. 2.
Fig. 2.
Evolution pathway of the mutants. (A) Nucleotides mutated by SHM in different rounds. Twenty random samples were sequenced in round 0, 8 in round 10, 8 in round 14, and 12 in round 23. (B) Amino acid mutations, quantum yields (QY), and extinction coefficients (EC) of different mutants. R10F5 represents mutant F5 from round 10. We named mutants R10D6 and R23H6 mRaspberry and mPlum, respectively. (C) Stereoview of mutation loci in mPlum based on the crystal structure of DsRed. The chromophore of RFP is shown in red. Residues are highlighted in yellow for emission-shift mutations and in gray for neutral mutations.
Fig. 3.
Fig. 3.
Characterization of evolved mutant proteins. (A) Fluorescence spectra of purified parental mRFP1.2 protein and representative mutant proteins from different rounds. Black dot, mRFP1.2; blue dash, mRaspberry; green dash dot, R14H4; red solid line, mPlum. In rounds 22 and 23, brighter cells were sorted while maintaining the ratio. Thus, mutants from rounds 21 and 23 have similar fluorescence spectra, except that round 23 mutants have larger extinction coefficients. All emission spectra were taken at the excitation wavelength 564 nm, and emission was monitored at 640 nm for excitation spectra. (B) Fluorescence intensity decay during photobleaching was at 14.3 W/cm2 at 568 nm. Color code is as in A.
Fig. 4.
Fig. 4.
Saturation mutagenesis analysis of positions identified by SHM in mPlum. (A) Fluorescence emission spectra of mutants with different mutations at position 65. All mutations other than the SHM-identified isoleucine dramatically blue-shift the emission. (B) Fluorescence emission spectra of mutants with different mutations at positions 124 and 127. Mutations at position 124 other than the SHM-identified valine broaden the emission peak to the short-wavelength side. Regardless of the mutations at position 127, mutants with leucine or cysteine at position 124 overlap, and mutants with valine at position 124 also overlap. (C) Fluorescence emission peaks of mPlum mutants with different mutations at positions 16 and 17 and positions 161 and 166. For saturation mutagenesis at positions 16 and 17, representative mutants with emission spanning from 614 to 649 nm were sequenced. For saturation mutagenesis at positions 161 and 166, only mutants with emissions of >640 nm were sequenced. Of 15 sequenced samples, methionine/lysine was found in 11 clones and serine/arginine in 2 clones.
Fig. 5.
Fig. 5.
Sequence alignments of the end of 3′ LTR from the retroviral vector, two clones of round 2, and mPlum. Mutations are shaded in black.

Similar articles

Cited by

References

    1. Minshull, J. & Stemmer, W. P. C. (1999) Curr. Opin. Chem. Biol. 3, 284–290. - PubMed
    1. Petrounia, I. P. & Arnold, F. H. (2000) Curr. Opin. Biotechnol. 11, 325–330. - PubMed
    1. Greener, A., Callahan, M. & Jerpseth, B. (1997) Mol. Biotechnol. 7, 189–195. - PubMed
    1. Papavasiliou, F. N. & Schatz, D. G. (2002) Cell 109, Suppl., S35–S44. - PubMed
    1. Martin, A. & Scharff, M. D. (2002) Nat. Rev. Immunol. 2, 605–614. - PubMed

Publication types

Associated data