. 2004 Dec;136(4):3905-19.
doi: 10.1104/pp.103.031591. Epub 2004 Nov 19.

Reorganization and in vivo dynamics of microtubules during Arabidopsis root hair development

Affiliations

Reorganization and in vivo dynamics of microtubules during Arabidopsis root hair development

Nathalie Van Bruaene et al. Plant Physiol. 2004 Dec.

Abstract

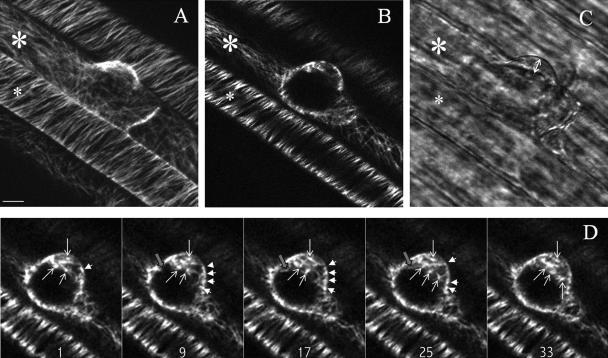
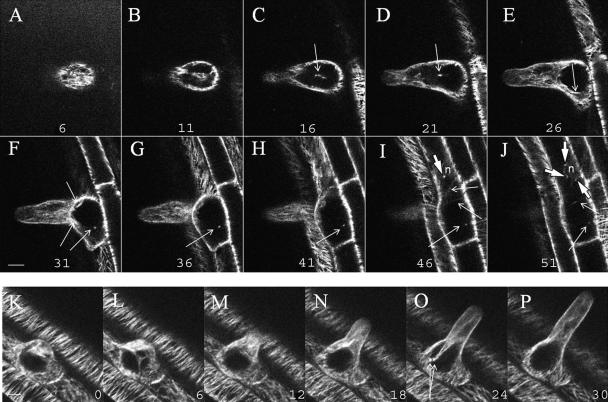
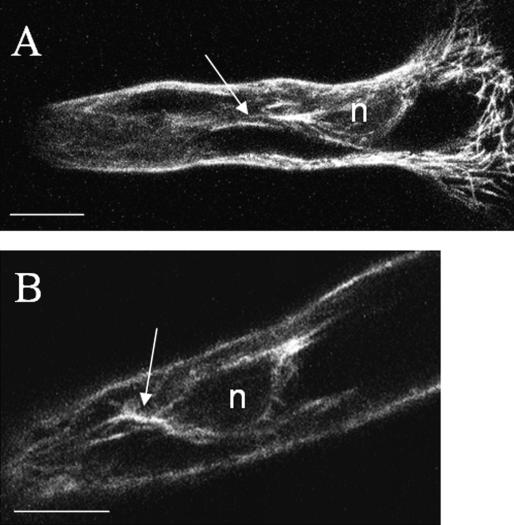
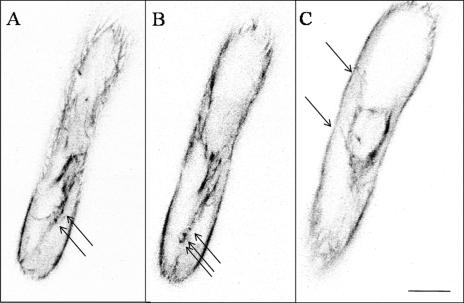
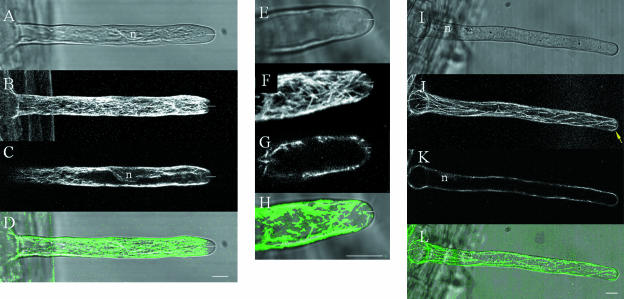
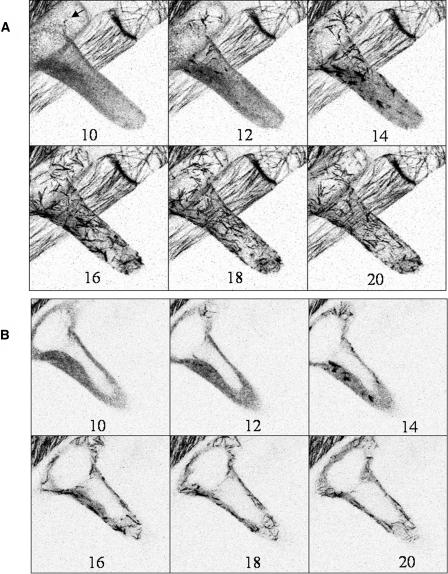
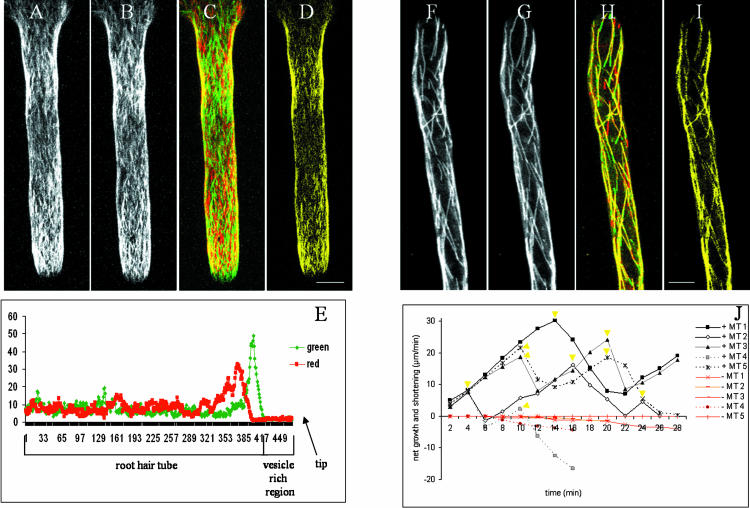
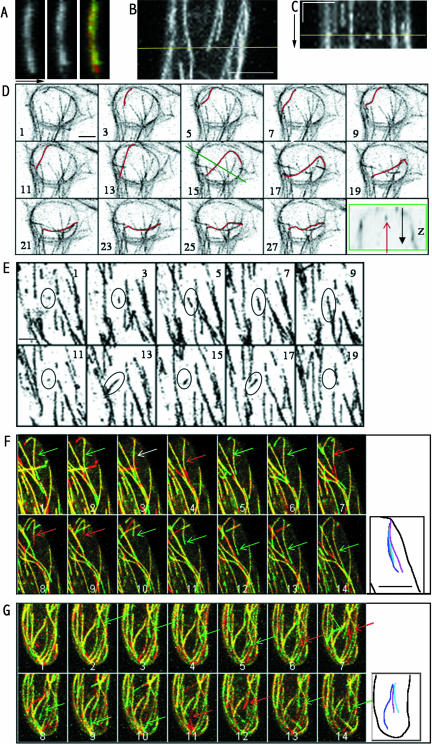
Root hairs emerge from epidermal root cells (trichoblasts) and differentiate by highly localized tip growth. Microtubules (MTs) are essential for establishing and maintaining the growth polarity of root hairs. The current knowledge about the configuration of the MT cytoskeleton during root hair development is largely based on experiments on fixed material, and reorganization and in vivo dynamics of MTs during root hair development is at present unclear. This in vivo study provides new insights into the mechanisms of MT (re)organization during root hair development in Arabidopsis (Arabidopsis thaliana). Expression of a binding site of the MT-associated protein-4 tagged with green fluorescent protein enabled imaging of MT nucleation, growth, and shortening and revealed distinct MT configurations. Depending on the dynamics of the different MT populations during root hair development, either repeated two-dimensional (x, y, t) or repeated three-dimensional (x, y, z, t) scanning was performed. Furthermore, a new image evaluation tool was developed to reveal important data on MT instability. The data show how MTs reorient after apparent contact with other MTs and support a model for MT alignment based on repeated reorientation of dynamic MT growth.


Figures

Figure 1.
Figure 1.
MT organization during bulge formation visualized with GFP-MBD of MAP4 and imaged with a confocal laser scanning microscope by 3-D sampling (x, y, z; A–C) and repeated 2-D sampling (x, y, t; D). A, Maximal projection of 25 optical sections at 1-μm (z) intervals of MTs in a bulge. The small asterisk indicates an atrichoblast; the large asterisk indicates a trichoblast. B, Single optical section at the endoplasmic region in the middle of the outgrowing root hair. C, Transmission image; double arrow indicates the vesicle-rich region of the outgrowing root hair. D, Time sequence showing the dynamics of apparent initiation sites. Five representative single-optical sections are shown from a series of 40 images taken at 1-s intervals (Supplemental Movie 1). The numbers indicate the time in seconds. The pointed arrows indicate the endoplasmic-apparent initiation sites, the arrowheads indicate the cortical-apparent initiation sites, and the gray-blocked arrow shows the growth of a single MT. Scale bar = 10 μm.
Figure 2.
Figure 2.
MT organization in a growing root hair visualized with a confocal laser scanning microscope in 3-D (x, y, z) and 4-D (x, y, z, t). The root hair is in an early stage of growth and the nucleus is not yet migrated into the tube. A–J, A series of 10 optical sections (x, y) with a separating distance of 2.5 μm. A, Optical section at the cortical region; E, optical section at the endoplasmic region. Arrowheads in I and J indicate the spots localized at the nuclear membrane, and arrows in C to J indicate cross sections of EMTs extending between the nucleus (n) and the tip or between the base and the tip of the root hair. Due to orientation of the cell and the EMTs, each optical section shows partial EMTs or cross sections of the EMTs. K to P, Six representative images from repeated 3-D scanning (x, y, z, t) over a period of 30 min. The numbers indicate the time in min. The images are represented as maximal projections of the four median-optical sections (x, y, z) with a separating distance of 1 μm in the endoplasmic region. The root hair was growing at a velocity of 1.4 μm/min. In O apparent initiation sites at the base of the root hair are indicated by arrows. Scale bar = 10 μm.
Figure 3.
Figure 3.
Configuration of EMTs around the nucleus (n) in late-stage-growing root hairs visualized with a confocal laser scanning microscope. A, Maximal projection of four median-optical sections at a separating distance of 1 μm; arrow indicates EMT bundle extending toward the tip. B, Single optical section through the nucleus. EMT fluorescence is present at the edge of the nucleus and is most intense at the ends toward the tip and the base of the root hair (arrow). Both root hair tips are oriented to the left. Scale bar = 10 μm.
Figure 4.
Figure 4.
Configuration of EMTs in late-stage-growing root hairs. Images are shown using an inverted grayscale to enhance the details. A, A representative image is shown out of a series of single optical sections taken every sec (x, y, t) with increased pinhole of 3 airy disc units. The complete sequences of 30 s are available as Supplemental Material (Supplemental Movie 6). The root hair is tilted and the image grazes only the cortex at the upper half of the image. The lower half shows the subcortical region; spots are indicated by arrows. B, Single optical section at the center of the root hair showing EMT bundles and spots (arrows). C, Optical section through the nucleus, single EMTs extend from the nucleus toward the cortical region (arrows). Root tip is oriented downwards. Scale bar = 10 μm.
Figure 5.
Figure 5.
Comparison of MT organization between late-stage-growing (A–D), growth-arresting (E–H), and full-grown (I–L) root hairs. Transmission images show the cytoarchitecture (A, E, and I); maximal projections of four upper-optical sections (x, y, z) show the CMTs (B, F, and J); maximal projections of four median-optical sections (x, y, z) show the EMTs (C, G, and K). Combination of the CMTs and transmission data show the relation between the cytoarchitecture and the CMT configuration at the root hair tip (CMTs in green; transmission in gray; D, H, and L). The nucleus is indicated by n, short white lines indicate the vesicle-rich region, and the yellow arrow indicates an MT curving in the root hair tip. Scale bars = 10 μm.
Figure 6.
Figure 6.
Visualization of MT recovery in an early stage-growing root hair following a 10-min treatment with the MT depolymerizing drug oryzalin (1 μm). The inverted grayscale image is shown to enhance the details. The numbers indicate the minutes after washing out oryzalin. A, Six images out of a time sequence of optical sections taken every minute (x, y, z, t). Numbers indicate time in minutes. The images represent maximal projections of 20 optical sections at a separating distance of 1 μm. B, Six images of the same time sequence as A, but maximal projections are restricted to the three median-optical sections through the endoplasmic region. The nucleus had not yet migrated in the root hair tube. Scale bar = 10 μm.
Figure 7.
Figure 7.
CMT dynamics in late-stage-growing (A–E) and full-grown (F–J) root hairs. Configuration of CMTs in growing and full-grown root hair represented as maximal projection of 20 optical sections (separating distance 1 μm) at 0 min (A and F) and at 1 min (B and G). Difference images of two time points (C and H), the images at 0 min (A and F) from the red channel, and images at 1 min (B and G) from the green channel. CMTs that did not change in position or length appear yellow (see also D and I). Intensity profile of red and green (not yellow) pixels along the root hair axis (length = 470 pixels; E). Root hair tip is not shown in F to I but oriented downwards. Life history plots show individual dynamics of CMT plus and minus ends. The yellow triangles indicate the time points where an apparent contact was detected. The deviation in orientation of the growth direction in respect to the previous growth direction for the different MTs: MT1, 8°; MT2, 7° and −2°; MT3, 5° and −3°; MT4, −7° and 11°; and MT5, 2°. Negative values indicate counter clockwise deviations (J). Scale bars = 10 μm.
Figure 8.
Figure 8.
CMT position and dynamics in full-grown root hairs. A, Vertical positioning of an MT over time; transects (x, z) through z-depth of an MT at two different time points (left section = 0 min, middle section = 20 min). The difference image (right section) in lower section shows that the MT did not move in the z-direction. Arrow indicates the z-direction. Height and width of image box is 6 and 14 μm, respectively. B, Maximal projection of (x, y, z) stack at one time point. Scale bar = 8 μm. C, Kymograph of a transect (yellow line in B) through the time sequence of maximal projections. Straight lines indicate no lateral movement of the MTs during the 30-min experiment. Vertical bar = 10 min, horizontal bar = 5 μm. Yellow line indicates position of maximal projection in B. D, Sequence of 14 images from repeated 3-D optical sections over time (x, y, z, t). Numbers indicate the time in minutes. The inverted-grayscale images are maximal projections of 20 optical sections with a separating distance of 1 μm taken at the base of the root hair. Newly formed MT shows lateral movement in the time sequence (MT colored in red). The green box in the extra section reveals the subcortical position of the MT in question and represents a (x, z) cross section taken through the optical sections at time point 15 min (position indicated by the green line in 15-min image). The red arrow shows the position of the single MT colored in red. The black arrow is the axis of increasing z. Scale bar = 5 μm. E, Formation of a new CMT. Sequence of 10 images from repeated 3-D optical sections over time (x, y, z, t) taken every minute. The images are maximal projections of the four upper-optical sections (with a separating distance of 1 μm) taken at the level of the cortex of the root hair. The ellipse indicates a single CMT. Initial growth is followed by complete shortening. Subsequent growth from the same site results in growth in a slightly different direction. This process is repeated several times over 20 min. Scale bar = 5 μm. F, Dynamic instability of CMTs at the base of the root hair. The images are the result of maximal projections of four upper-optical sections at a separating distance of 1 μm repeated over time (every 2 min). Numbers indicate number of section. Dynamics is illustrated by the green (growth)/ red (shortening) difference image. For detailed information concerning this technique, see results section. An individual CMT is indicated by an arrow. The green, red, and white color of the arrow indicates growth, shortening, and pause, respectively. Extra section shows reorientation of CMT after a shortening event and subsequent growth; light-blue line corresponds with time point 3, dark blue with time point 6, and magenta with time point 14. Scale bar = 10 μm. G, Dynamic instability at the root hair tip represented in the way as explained in F. Note that section G7 shows two arrows indicating shortening and subsequent growth in a different direction of the same CMT. Light-blue line in extra section shows CMT position at time point 5, dark blue at time point 9, and magenta at time point 14. All root hairs tips are oriented downwards.

Similar articles

Cited by

References

    1. Baluška F, Parker JS, Barlow PW (1992) Specific patterns of cortical and endoplasmic microtubules associated with cell growth and tissue differentiation in roots of maize (Zea mays L.). J Cell Sci 103: 191–200
    1. Baluška F, Šalaj J, Mathur J, Braun M, Jasper F, Šamaj J, Chua NH, Barlow PW, Volkmann D (2000) Root hair formation: F-actin-dependent tip growth is initiated by local assembly of profilin-supported F-actin meshworks accumulated within expansin-enriched bulges. Dev Biol 227: 618–632 - PubMed
    1. Bao YQ, Kost B, Chua NH (2001) Reduced expression of α-tubulin genes in Arabidopsis thaliana specifically affects root growth and morphology, root hair development and root gravitropism. Plant J 28: 145–157 - PubMed
    1. Bibikova TN, Blancaflor EB, Gilroy S (1999) Microtubules regulate tip growth and orientation in root hairs of Arabidopsis thaliana. Plant J 17: 657–665 - PubMed
    1. Bichet A, Desnos T, Turner S, Grandjean O, Höfte H (2001) BOTERO1 is required for normal orientation of cortical microtubules and anisotropic cell expansion in Arabidopsis. Plant J 25: 137–148 - PubMed

MeSH terms

LinkOut - more resources