. 2004 Nov 22;167(4):769-81.
doi: 10.1083/jcb.200408028.

Tumor cell traffic through the extracellular matrix is controlled by the membrane-anchored collagenase MT1-MMP

Affiliations

Tumor cell traffic through the extracellular matrix is controlled by the membrane-anchored collagenase MT1-MMP

Farideh Sabeh et al. J Cell Biol. .

Abstract

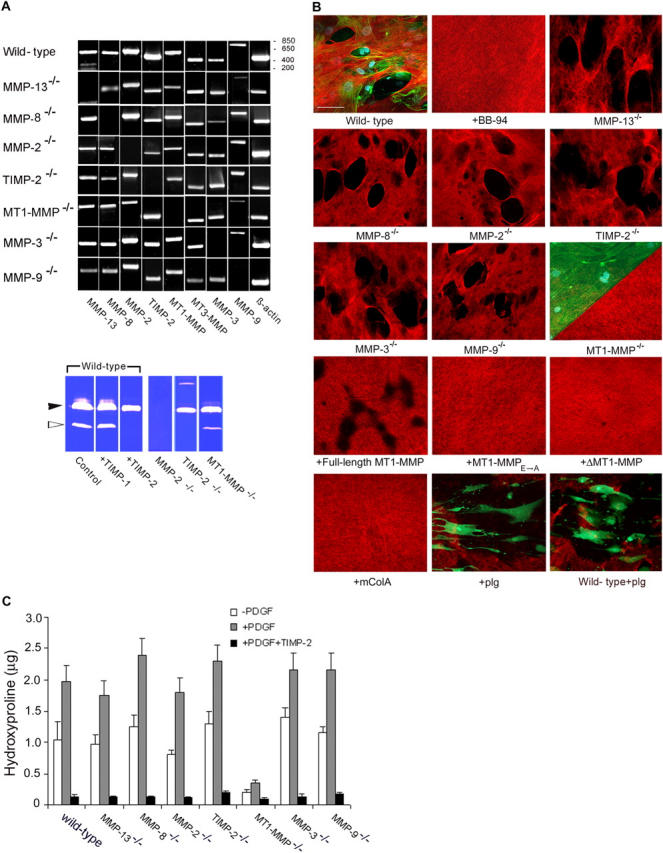
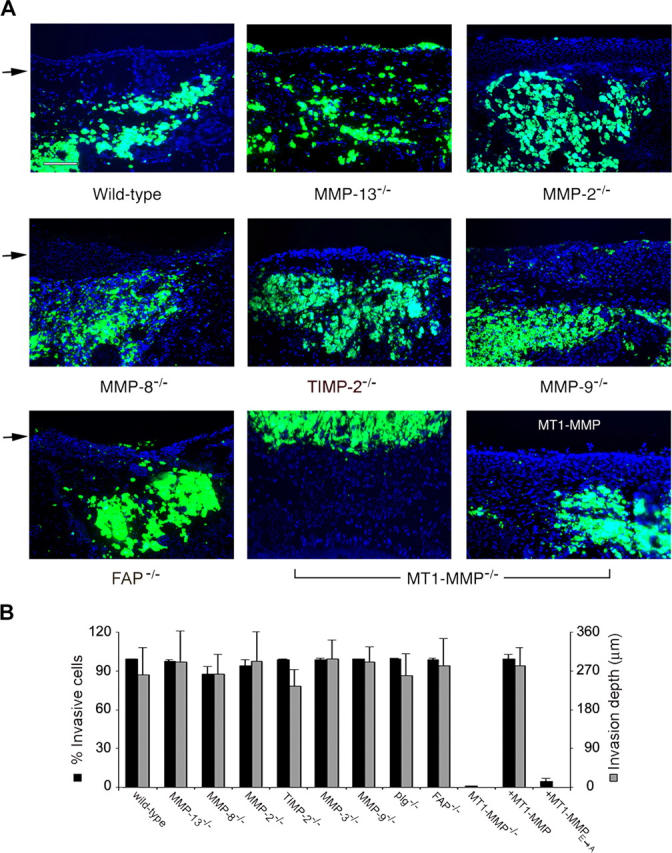
As cancer cells traverse collagen-rich extracellular matrix (ECM) barriers and intravasate, they adopt a fibroblast-like phenotype and engage undefined proteolytic cascades that mediate invasive activity. Herein, we find that fibroblasts and cancer cells express an indistinguishable pericellular collagenolytic activity that allows them to traverse the ECM. Using fibroblasts isolated from gene-targeted mice, a matrix metalloproteinase (MMP)-dependent activity is identified that drives invasion independently of plasminogen, the gelatinase A/TIMP-2 axis, gelatinase B, collagenase-3, collagenase-2, or stromelysin-1. In contrast, deleting or suppressing expression of the membrane-tethered MMP, MT1-MMP, in fibroblasts or tumor cells results in a loss of collagenolytic and invasive activity in vitro or in vivo. Thus, MT1-MMP serves as the major cell-associated proteinase necessary to confer normal or neoplastic cells with invasive activity.


Figures

Figure 1.
Figure 1.
Collagen-invasive and -degradative activities of fibroblasts and tumor cells. (A) Transmission electron micrographs of fibroblast monolayers cultured atop three-dimensional collagen gels (2.2 mg/ml) with PDGF-BB (10 ng/ml) in the presence of 10% serum at the start of the culture period (0 d) or after 6 d in either the absence or presence of 5 μM BB-94. Zones of collagen clearing are observed in areas surrounding invading cells (middle, arrows). Double-headed arrow indicates the position of the underlying gel. Bar, 10 μm. (B) Laser confocal micrographs of rhodamine-labeled collagen gels (2.2 mg/ml) incubated with fibroblasts and PDGF in 10% serum for 0 or 6 d in the absence or presence of BB-94. Bar, 10 μm. (C) Immunofluorescent staining of collagen cross sections reveals zones of denatured collagen (stained green, arrowheads) surrounding invading fibroblasts (stained red, arrow) in the absence, but not the presence, of BB-94. Bar, 100 μm. (D) Light micrographs of SCC-1 monolayers cultured atop collagen gels (2.2 mg/ml) and stimulated with hepatocyte growth factor (HGF; 50 ng/ml) in 10% serum for 0 or 4 d in the absence or presence of BB-94. Arrows indicate islands of invasive cells. Bar, 100 μm. (E) HGF-stimulated SCC-1 cells were cultured atop three-dimensional gels of rhodamine-labeled collagen gels for 4 d in the presence of 10% serum, and tunneling behavior was assessed by laser confocal microscopy. Tunnels were not observed in the presence of BB-94. SCC-1 cells (stained with DAPI and phalloidin) invade rhodamine-labeled, pepsin-extracted collagen gels without generating tunnels. (F and G) Fibroblast (F) or tumor cell (HT1080 and SCC-1; G) invasion and collagenolytic activities were monitored in three-dimensional collagen gels (2.2 mg/ml) supplemented with 10% serum in the absence or presence of inhibitors for 6 or 4 d, respectively. Results are expressed as the mean ± 1 SEM of three or more experiments.
Figure 2.
Figure 2.
Fibroblast MMP expression profile and collagenolytic activity. (A, top) RT-PCR analysis of MMP expression of wild-type and null fibroblasts cultured atop collagen gels in 10% serum for 3 d with PDGF. (bottom) Gelatin zymography of serum-free supernatants recovered from the wild-type, MMP-2−/−, TIMP-2−/−, or MT1-MMP−/− fibroblasts cultured with PDGF alone (Control) or with either TIMP-1 or TIMP-2. Wild-type fibroblasts express pro-MMP-2 (black arrowhead) and generate mature MMP-2 (white arrowhead) via a TIMP-2-sensitive process. No MMP-2 was detected in MMP-2−/− cultures, whereas mature MMP-2 was not generated in the TIMP-2−/− cultures. The identity of the high Mr gelatinolytic species in the supernatant of TIMP-2−/− fibroblasts is unknown. (B and C) Collagenolytic activity of fibroblasts seeded on a type I collagen film as assessed by confocal laser microscopy (B) or hydroxyproline release (C). Fibroblasts were seeded atop a 100 μg/2.2 cm2 film of rhodamine-labeled collagen and stimulated with PDGF without or with BB-94 in 10% autologous mouse serum or cultured under serum-free conditions with PDGF in the presence of 20 μg/ml of plasminogen for 5 d. (B) Wild-type or MT1-MMP−/− fibroblasts were labeled with calcein-AM (green) and DAPI (blue) in the merged images (first, ninth, and last two images in the series). Bar, 100 μm. (C) Hydroxyproline release was monitored in 10% serum without or with PDGF in the absence or presence of TIMP-2. Results are expressed as the mean ± 1 SEM of three or more experiments.
Figure 3.
Figure 3.
MT1-MMP regulates collagen-degradative activity in tumor cells. (A) Degradative activity of HT-1080 cells (5 × 10⁴) cultured atop a film of rhodamine-labeled type I collagen (100 μg/2.2 cm2) in the presence of 10% serum alone (HT-1080; stained with phalloidin/DAPI), or with BB-94, TIMP-1, or TIMP-2. Zones of collagen degradation were monitored by confocal laser microscopy after 3 d. (B) Western blot analysis of MT1-MMP (top) expression in HT-1080 or SCC-1 cells before or after electroporation with a 21-bp MT1-MMP siRNA (MT1-siRNA) or after coelectroporation of MT1-siRNA with a mouse MT1-MMP plasmid (mMT1). Gelatin zymography (bottom) of serum-free supernatants recovered from control or MT1-siRNA–treated HT-1080 or SCC-1 cells after 2 d in culture. MMP-2 (72 kD) and MMP-9 (92 kD) expression are not affected by MT1-siRNA as assessed by zymography. Control HT-1080 cells generate pro-MMP-2 (black arrowhead) and mature MMP-2 (white arrowhead). (C) HT-1080 cells were either treated with a control-siRNA, MT1-siRNA, or coelectroporated with MT1-siRNA and either MMP-1RXKR, MMP-13RXKR, MMP-2RXKR, or mMT1-MMP expression vectors, cultured for 3 d atop a film of rhodamine-labeled type I collagen in 10% serum, and zones of collagen degradation monitored by confocal laser microscopy. In the top section of the split image of MT1-siRNA–treated HT-1080 cells, the phalloidin/DAPI-stained tumor cells are shown atop the collagen film, whereas the lower section displays the underlying collagen layer alone. Results are representative of four performed. Bar, 100 μm.
Figure 4.
Figure 4.
Fibroblast MT1-MMP mediates collagen-invasive activity. (A–C) Wild-type and null fibroblasts were cultured atop type I collagen gels (2.2 mg/ml; top two rows, 2-D) or within three-dimensional collagen gels (2.2 mg/ml; bottom row) in 10% serum and stimulated with a PDGF gradient (10 ng/ml) for 6 d in the absence or presence of TIMP-2. The arrow to the left of the panels marks the surface of the collagen monolayer or the edge of the embedded island of fibroblasts. Arrows within the gel indicate positions of invading fibroblasts. Bars, 100 μm. Invasion (B) and collagen degradation (C) were quantified in three-dimensional collagen gels in the presence of 10% wild-type serum save for experiments with MMP-2−/−, MMP-9−/−, or TIMP-2−/− fibroblasts, where null serum was isolated from each of the respective mouse strains. Results are expressed as the mean ± 1 SEM of three or more experiments.
Figure 5.
Figure 5.
CAM invasion by wild-type and MMP-null fibroblasts. (A) Fibroblasts from wild-type, MMP-deficient, or FAP-null mice were labeled with fluorescent microbeads (green) and seeded atop the CAM of 11-d-old chicks and cultured for 3 d. Fluorescent micrographs of CAM cross sections demonstrate the ability of mouse fibroblasts to penetrate the CAM surface (DAPI-stained, blue nuclei of chick cells at the CAM surface are highlighted by arrows). The MT1-MMP−/− defect was reversed by transient transfection of MT1-MMP−/− cells with MT1-MMP. Results are representative of four performed. Bar, 100 μm. (B) Invasion was quantified as the percentage of wild-type or null fibroblasts that traversed the CAM surface and the mean depth of invasion of the leading front of three or more fibroblasts. Results are expressed as the mean ± 1 SD of at least three experiments.
Figure 6.
Figure 6.
MT1-MMP drives cancer cell invasion and intravasation. (A and B) HT-1080 or SCC-1 cells were incubated alone with TIMP-1, TIMP-2, a 21-bp MT1-MMP siRNA, or a 21-bp control siRNA and cultured atop a rhodamine-labeled type I collagen gel (2.2 mg/ml) in 10% serum with 50 ng/ml HGF for 3 d. Tunneling behavior of HT-1080 and SCC-1 cells (A) was monitored by confocal laser microscopy (bottom, merged images of phalloidin/DAPI-labeled SCC-1 cells and the surrounding rhodamine-labeled collagen are shown). Invasive foci and hydroxyproline release for HT-1080 and SCC-1 cells were quantified as described in B. Where indicated, MT1-MMP siRNA-treated cells were transfected with a mouse MT1-MMP (mMT1-MMP) expression vector (MT1-siRNA/mMT1). (C) CAM invasion by fluorescent nanobead-labeled HT-1080 or SCC-1 cells incubated alone, electroporated with MT1-siRNA alone, or coelectroporated with MT1-siRNA and a mMT1-MMP expression vector. Tumor cell invasion was visualized by fluorescent microscopy of CAM cross sections after a 3-d incubation period. The CAM surface is marked by arrows. Percent invasion for control-siRNA–, MT1-siRNA–, and mMT1-MMP–transfected MT1-siRNA–treated HT-1080 cells was 24 ± 7%, 1 ± 1%, and 25 ± 3%, respectively, and for SCC-1 cells was 15.8 ± 1%, 1 ± 1%, and 16 ± 4%, respectively (mean ± 1 SD; n = 3). (D) Invasion of human dermal explants by HT-1080 cells after electroporation with a control siRNA or MT1-siRNA and cultured atop the CAM for 3 d. The percentage of invading cells and invasion depth for control siRNA- and MT1 siRNA-treated HT-1080 cells, respectively, were 16.9 ± 5.9% and 144.1 ± 47.6 μm and 2.9 ± 0.2% and 22.9 ± 10.8 μm. (E) Tumor cell intravasation/extravasation was detected as Alu-sequences by PCR on DNA extracted from the lower CAM for either HT-1080 or SCC-1 cells after a 3-d incubation period. Chick GAPDH (chGAPDH) serves as the loading control. Results are representative of four experiments performed. Bars, 100 μm.

References

    1. Armstrong, P.B., J.P. Quigley, and E. Sidebottom. 1982. Transepithelial invasion and intramesenchymal infiltration of the chick embryo chorioallantois by tumor cell lines. Cancer Res. 42:1826–1837. - PubMed
    1. Balbin, M., A. Fueyo, V. Knauper, J.M. Lopez, J. Alvarez, L.M. Sanchez, V. Quesada, J. Bordallo, G. Murphy, and V. Lopez-Otin. 2001. Identification and enzymatic characterization of two diverging murine counterparts of human interstitial collagenase (MMP-1) expressed at sites of embryo implantation. J. Biol. Chem. 276:10253–10262. - PubMed
    1. Balbin, M., A. Fueyo, A.M. Tester, A.M. Pendas, A.S. Pitiot, A. Astudillo, C.M. Overall, S.D. Shapiro, and C. Lopez-Otin. 2003. Loss of collagen-2 confers increased skin tumor susceptibility to male mice. Nat. Genet. 35:252–257. - PubMed
    1. Benbow, U., M.P. Schoenermark, T.I. Mitchell, J.L. Rutter, K. Shimokawa, H. Nagase, and C.E. Brinckerhoff. 1999. A novel host/tumor cell interaction activates matrix metalloproteinase 1 and mediates invasion through type I collagen. J. Biol. Chem. 274:25371–25378. - PubMed
    1. Birkedal-Hansen, H. 1987. Catabolism and turnover of collagens: collagenases. Methods Enzymol. 144:140–171. - PubMed

Publication types

MeSH terms

LinkOut - more resources