

The impact of SARS on a tertiary care pediatric emergency department
- PMID: 15557588
- PMCID: PMC527337
- DOI: 10.1503/cmaj.1031257
The impact of SARS on a tertiary care pediatric emergency department
Abstract
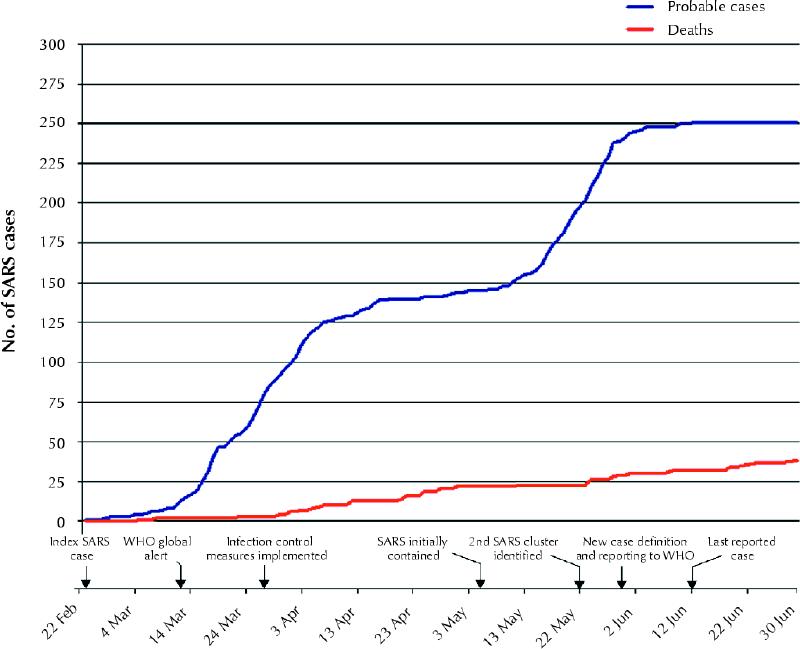
Background: The Greater Toronto Area (GTA) was considered a "hot zone" for severe acute respiratory syndrome (SARS) in 2003. In accordance with mandated city-wide infection control measures, the Hospital for Sick Children (HSC) drastically reduced all services while maintaining a fully operational emergency department. Because of the GTA health service suspensions and the overlap of SARS-like symptoms with many common childhood illnesses, this introduced the potential for a change in the volumes of patients visiting the emergency department of the only regional tertiary care children's hospital.
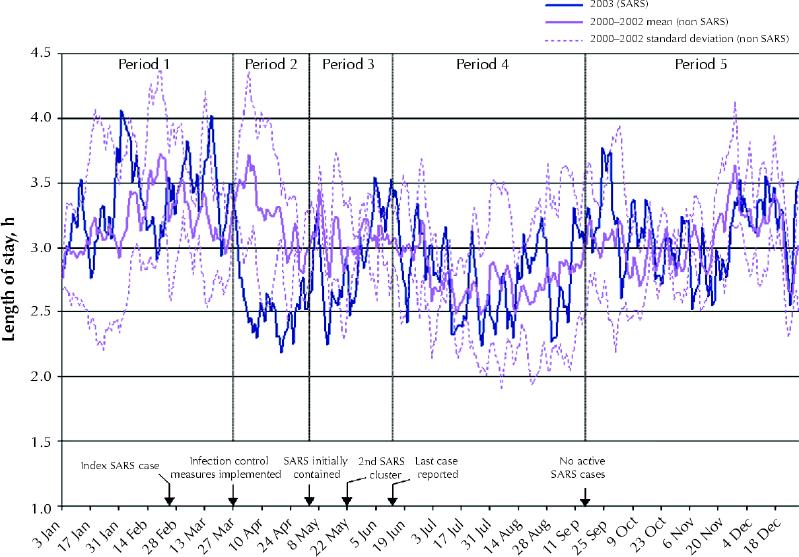
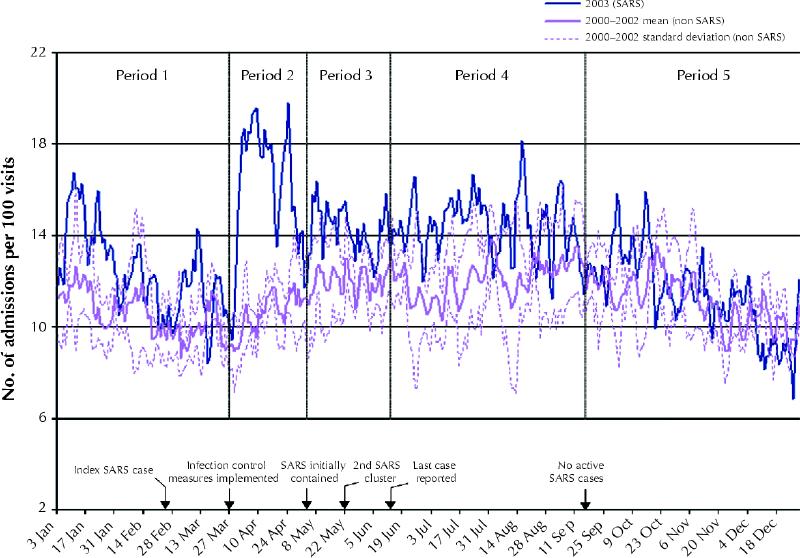
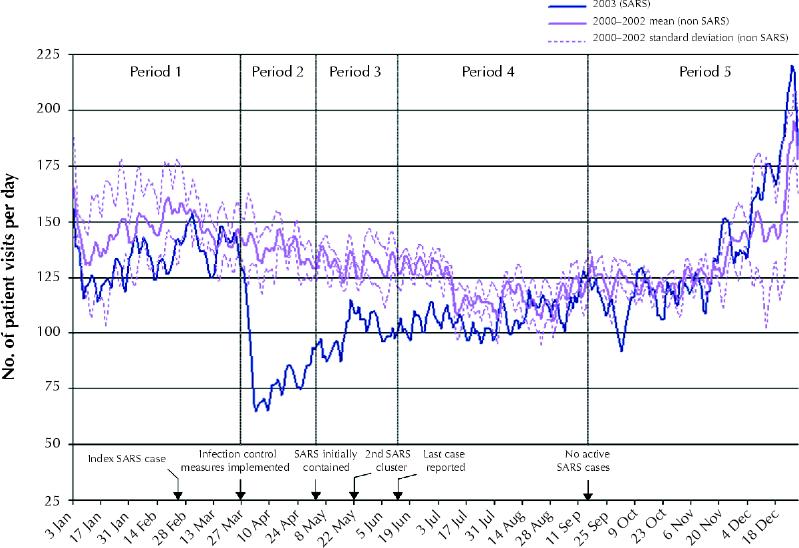
Methods: We compared HSC emergency department patient volumes, admission rates and length of stay in the emergency department in the baseline years of 2000-2002 (non-SARS years) with those in 2003 (SARS year). The data from the prior years were modeled as a time series. Using an interrupted time series analysis, we compared the 2003 data for the periods before, during and after the SARS periods with the modeled data for significant differences in the 3 aforementioned outcomes of interest.
Results: Compared with the 2000-2002 data, we found no differences in visits, admission rates or length of stay in the pre-SARS period in 2003. There were significant decreases in visits and length of stay (p < 0.001) and increases in admission rates (p < 0.001) during the periods in 2003 when there were new and active cases of SARS in the GTA. All 3 outcomes returned to expected estimates coincident with the absence of SARS cases from September to December 2003.
Interpretation: During the SARS outbreak in the GTA, the HSC emergency department experienced significantly reduced volumes of patients with low-acuity complaints. This gives insight into utilization rates of a pediatric emergency department during a time when there was additional perceived risk in using emergency department services and provides a foundation for emergency department preparedness policies for SARS-like public health emergencies.
Figures
Similar articles
-
The impact of SARS on hospital performance.BMC Health Serv Res. 2008 Nov 6;8:228. doi: 10.1186/1472-6963-8-228. BMC Health Serv Res. 2008. PMID: 18990210 Free PMC article.
-
Effect of widespread restrictions on the use of hospital services during an outbreak of severe acute respiratory syndrome.CMAJ. 2007 Jun 19;176(13):1827-32. doi: 10.1503/cmaj.061174. CMAJ. 2007. PMID: 17576979 Free PMC article.
-
Impact of a severe acute respiratory syndrome outbreak in the emergency department: an experience in Taiwan.Emerg Med J. 2004 Nov;21(6):660-2. doi: 10.1136/emj.2003.010678. Emerg Med J. 2004. PMID: 15496687 Free PMC article.
-
Measures for decreasing inpatient stay in childhood asthma.Int J Clin Pract. 1999 Sep;53(6):452-5. Int J Clin Pract. 1999. PMID: 10622073 Review.
-
[Analysis of the aetiologies of headaches in a paediatric emergency service].Rev Neurol. 2004 Aug 1-15;39(3):217-21. Rev Neurol. 2004. PMID: 15284960 Review. Spanish.
Cited by
-
Pediatric emergency department utilization during the COVID-19 pandemic in New York City.Am J Emerg Med. 2021 Jul;45:100-104. doi: 10.1016/j.ajem.2021.02.029. Epub 2021 Feb 20. Am J Emerg Med. 2021. PMID: 33677263 Free PMC article.
-
Six Diagnoses of Separation: Impact of COVID-19 on Pediatric Emergency Department Visits: A Multicenter Study.J Emerg Med. 2022 Dec;63(6):723-728. doi: 10.1016/j.jemermed.2022.09.008. Epub 2022 Sep 20. J Emerg Med. 2022. PMID: 36522811 Free PMC article.
-
The impact of SARS on hospital performance.BMC Health Serv Res. 2008 Nov 6;8:228. doi: 10.1186/1472-6963-8-228. BMC Health Serv Res. 2008. PMID: 18990210 Free PMC article.
-
Population mortality during the outbreak of Severe Acute Respiratory Syndrome in Toronto.BMC Public Health. 2007 May 29;7:93. doi: 10.1186/1471-2458-7-93. BMC Public Health. 2007. PMID: 17535440 Free PMC article.
-
The Effect of the COVID-19 Pandemic on the Economics of United States Emergency Care.Ann Emerg Med. 2021 Oct;78(4):487-499. doi: 10.1016/j.annemergmed.2021.04.026. Epub 2021 Apr 27. Ann Emerg Med. 2021. PMID: 34120751 Free PMC article.
References
-
- Drosten C, Gunther S, Preiser W, van der Werf S, Brodt HR, Becker S, et al. Identification of a novel coronavirus in patients with severe acute respiratory syndrome. N Engl J Med 2003;348:1967-76. Epub 2003 Apr 10 (DOI 10.1056 /NEJMoa030747). - PubMed
-
- Ksiazek TG, Erdman D, Goldsmith CS, Zaki SR, Peret T, Emery S, et al. A novel coronavirus associated with severe acute respiratory syndrome. N Engl J Med 2003;348:1953-66. Epub 2003 Apr 10 (DOI 10.1056/NEJMoa030781). - PubMed
-
- Latest Canadian numbers on SARS. Ottawa: Health Canada; 2003 June 17. Available: www.hc-sc.gc.ca/english/protection/warnings/sars/sars_numbers.html (accessed 2004 Jul 05).
-
- Poutanen SM, Low DE, Henry B, Finkelstein S, Rose D, Green K, et al. Identification of severe acute respiratory syndrome in Canada. N Engl J Med 2003;348:1995-2005. Epub 2003 Mar 31 (DOI 10.1056/NEJMoa030634). - PubMed
-
- Booth CM, Matukas LM, Tomlinson GA, Rachlis AR, Rose DB, Dwosh HA, et al. Clinical features and short-term outcomes of 144 patients with SARS in the Greater Toronto Area. JAMA 2003;289(21):2801-9. - PubMed
Publication types
MeSH terms
LinkOut - more resources
Full Text Sources
Medical
Miscellaneous