

Combination of a hepatitis C virus NS3-NS4A protease inhibitor and alpha interferon synergistically inhibits viral RNA replication and facilitates viral RNA clearance in replicon cells
- PMID: 15561857
- PMCID: PMC529208
- DOI: 10.1128/AAC.48.12.4784-4792.2004
Combination of a hepatitis C virus NS3-NS4A protease inhibitor and alpha interferon synergistically inhibits viral RNA replication and facilitates viral RNA clearance in replicon cells
Abstract
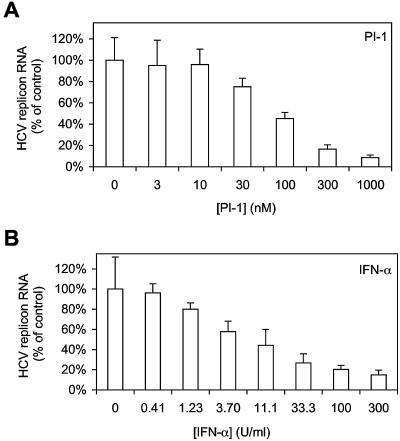
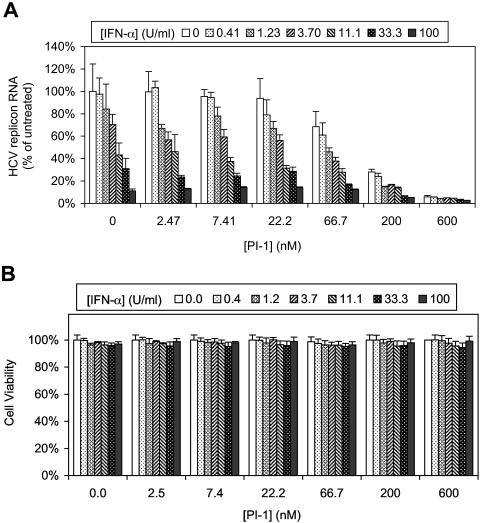
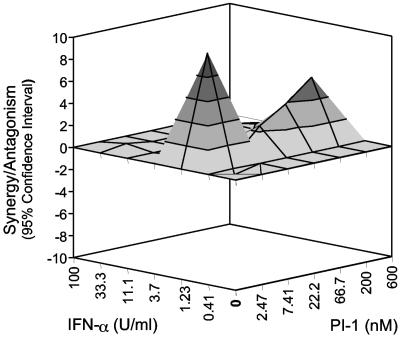
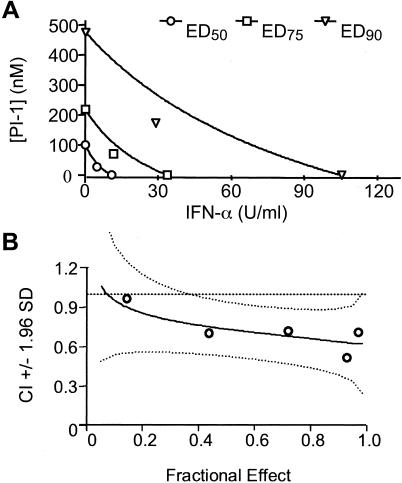
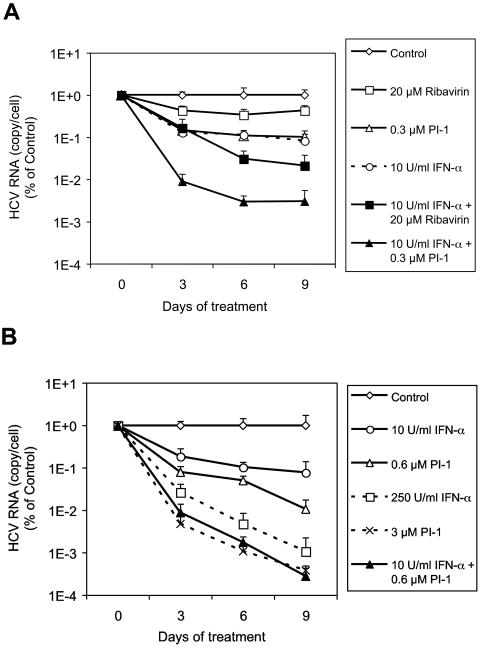
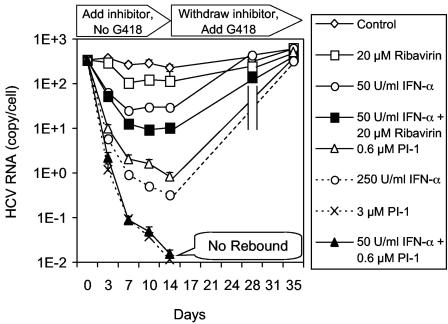
The present standard of care for hepatitis C virus (HCV) infection is pegylated alpha interferon (IFN-alpha) in combination with ribavirin. However, specific antivirals such as HCV NS3-NS4A protease inhibitors are now in clinical development, and these agents can potentially be used in combination with the present treatments. Therefore, it is important to investigate the potential benefits or adverse effects of these new combinations by using available in vitro HCV culture systems first. In the present study we demonstrate that the combination of a specific HCV NS3-NS4A protease inhibitor and IFN-alpha synergistically inhibits HCV RNA replication in replicon cells, with little or no increase in cytotoxicity. Furthermore, the benefit of the combination was sustained over time, such that a greater than 3-log reduction in HCV RNA levels was achieved following 9 days of treatment. The viral RNA appeared to be cleared from the replicon cells after 14 days of treatment, and no viral RNA rebound was observed upon withdrawal of the inhibitors. In each case, the antiviral effects obtained with higher concentrations of either the protease inhibitor alone or IFN-alpha alone can be achieved by a combination of both agents at lower concentrations, which may potentially reduce the risk of possible adverse effects associated with high doses of either agent.
Figures
Similar articles
-
Establishment of a subgenomic replicon for bovine viral diarrhea virus in Huh-7 cells and modulation of interferon-regulated factor 3-mediated antiviral response.J Virol. 2005 Mar;79(5):2788-96. doi: 10.1128/JVI.79.5.2788-2796.2005. J Virol. 2005. PMID: 15708997 Free PMC article.
-
Enhancement of antiviral activity against hepatitis C virus in vitro by interferon combination therapy.Antiviral Res. 2005 Jan;65(1):23-34. doi: 10.1016/j.antiviral.2004.09.002. Antiviral Res. 2005. PMID: 15652968
-
In vitro antiviral activity of SCH446211 (SCH6), a novel inhibitor of the hepatitis C virus NS3 serine protease.J Antimicrob Chemother. 2007 Jan;59(1):51-8. doi: 10.1093/jac/dkl455. Epub 2006 Dec 5. J Antimicrob Chemother. 2007. PMID: 17151003
-
A review of HCV protease inhibitors.Curr Opin Investig Drugs. 2009 Aug;10(8):821-37. Curr Opin Investig Drugs. 2009. PMID: 19649927 Review.
-
Challenges in modern drug discovery: a case study of boceprevir, an HCV protease inhibitor for the treatment of hepatitis C virus infection.Acc Chem Res. 2008 Jan;41(1):50-9. doi: 10.1021/ar700109k. Acc Chem Res. 2008. PMID: 18193821 Review.
Cited by
-
Analysis of hepatitis C virus decline during treatment with the protease inhibitor danoprevir using a multiscale model.PLoS Comput Biol. 2013;9(3):e1002959. doi: 10.1371/journal.pcbi.1002959. Epub 2013 Mar 14. PLoS Comput Biol. 2013. PMID: 23516348 Free PMC article.
-
Development of nsP2 protease based cell free high throughput screening assay for evaluation of inhibitors against emerging Chikungunya virus.Sci Rep. 2018 Jul 17;8(1):10831. doi: 10.1038/s41598-018-29024-2. Sci Rep. 2018. PMID: 30018455 Free PMC article.
-
NIM811, a cyclophilin inhibitor, exhibits potent in vitro activity against hepatitis C virus alone or in combination with alpha interferon.Antimicrob Agents Chemother. 2006 Sep;50(9):2976-82. doi: 10.1128/AAC.00310-06. Antimicrob Agents Chemother. 2006. PMID: 16940091 Free PMC article.
-
Virologic characterization of genotype 4 hepatitis C virus variants in patients treated with telaprevir.Virol J. 2014 May 16;11:93. doi: 10.1186/1743-422X-11-93. Virol J. 2014. PMID: 24886541 Free PMC article. Clinical Trial.
-
A viral dynamic model for treatment regimens with direct-acting antivirals for chronic hepatitis C infection.PLoS Comput Biol. 2012 Jan;8(1):e1002339. doi: 10.1371/journal.pcbi.1002339. Epub 2012 Jan 5. PLoS Comput Biol. 2012. PMID: 22241977 Free PMC article.
References
-
- Babine, R. E., S. H. Chen, J. E. Lamar, N. J. Snyder, X. D. Sun, M. J. Tebee, F. Victor, Q. M. Wang, Y. Y. M. Yip, I. Collado, C. Garcia-Paredes, R. S. I. Parker, L. Jin, D. Guo, and J. I. Glass. 7. March 2002. Peptidomimetic protease inhibitors. WO patent 02/018369.
-
- Blight, K. J., A. A. Kolykhalov, and C. M. Rice. 2000. Efficient initiation of HCV RNA replication in cell culture. Science 290:1972-1974. - PubMed
-
- Chou, T. C., and P. Talalay. 1977. A simple generalized equation for the analysis of multiple inhibitions of Michaelis-Menten kinetic systems. J. Biol. Chem. 252:6438-6442. - PubMed
-
- De Francesco, R., L. Tomei, S. Altamura, V. Summa, and G. Migliaccio. 2003. Approaching a new era for hepatitis C virus therapy: inhibitors of the NS3-4A serine protease and the NS5B RNA-dependent RNA polymerase. Antivir. Res. 58:1-16. - PubMed
MeSH terms
Substances
LinkOut - more resources
Full Text Sources
Other Literature Sources
