. 2004 Dec;52(6):1263-71.
doi: 10.1002/mrm.20266.

In vivo visualization of Alzheimer's amyloid plaques by magnetic resonance imaging in transgenic mice without a contrast agent

Affiliations

In vivo visualization of Alzheimer's amyloid plaques by magnetic resonance imaging in transgenic mice without a contrast agent

Clifford R Jack Jr et al. Magn Reson Med. 2004 Dec.

Abstract

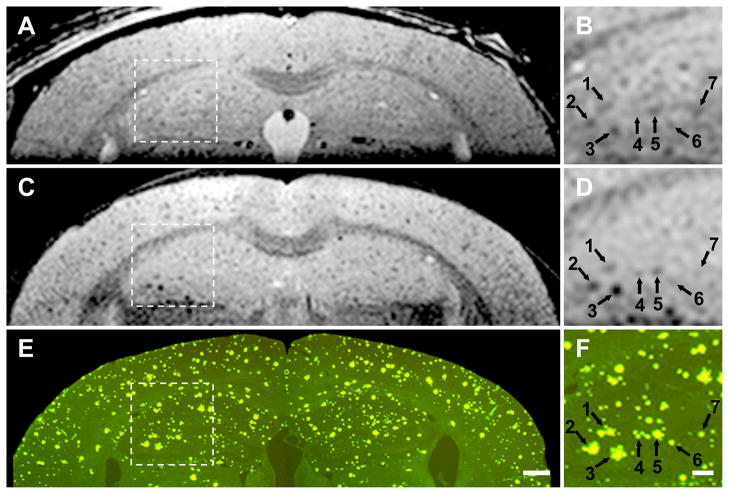
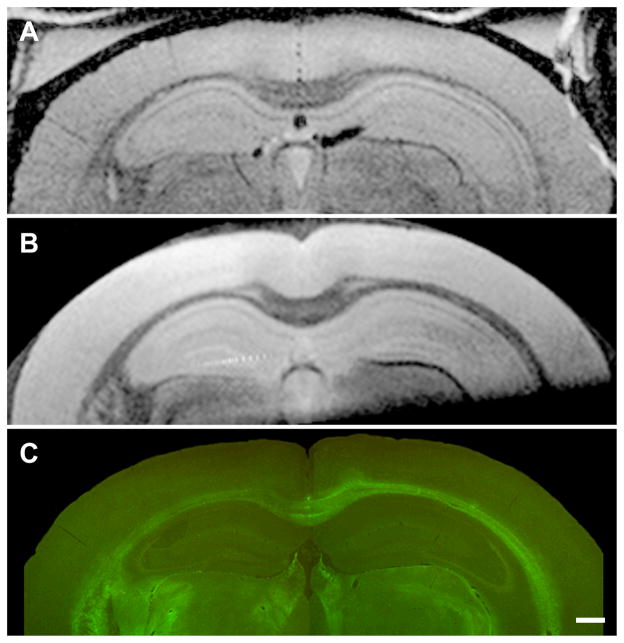
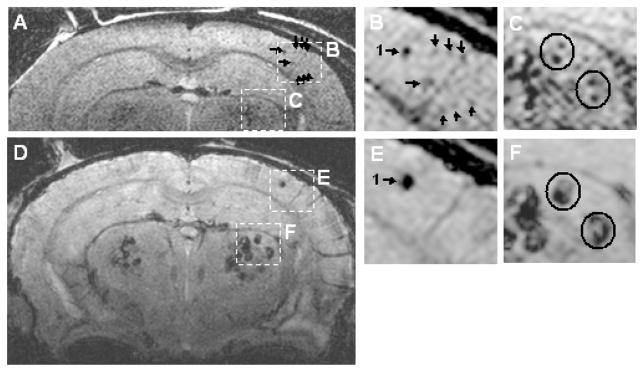
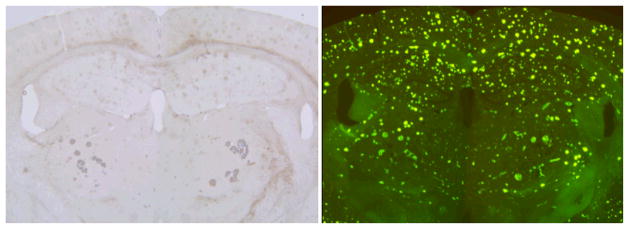
One of the cardinal pathologic features of Alzheimer's disease (AD) is the formation of senile, or amyloid, plaques. Transgenic mice have been developed that express one or more of the genes responsible for familial AD in humans. Doubly transgenic mice develop "human-like" plaques, providing a mechanism to study amyloid plaque biology in a controlled manner. Imaging of labeled plaques has been accomplished with other modalities, but only MRI has sufficient spatial and contrast resolution to visualize individual plaques noninvasively. Methods to optimize visualization of plaques in vivo in transgenic mice at 9.4 T using a spin echo sequence based on adiabatic pulses are described. Preliminary results indicate that a spin echo acquisition more accurately reflects plaque size, while a T2* weighted gradient echo sequence reflects plaque iron content, not plaque size. In vivo MRI-ex vivo MRI-in vitro histologic correlations are provided. Histologically verified plaques as small as 50 microm in diameter were visualized in living animals. To our knowledge this work represents the first demonstration of noninvasive in vivo visualization of individual AD plaques without the use of a contrast agent.


Figures

Figure 1
Figure 1. Coil and mouse holder apparatus
The top panel shows a mouse lying in the cradle from above. Its head is held in place with adjustable plastic side clamps and an adjustable incisor bar. The incisors are placed into a hole in the bar and the mouse is held in place with a Velcro strap positioned over the nose. The nose is inserted into a cone which supplies anesthesia gas and O2/N2O and also scavenges residual gas. The bottom panel is a view from behind the mouse’s head illustrating the surface coil in position.
Figure 2
Figure 2. Spin-echo 3D Imaging Sequence
To confer insensitivity to view-to-view variations in Mz that result from inconsistent timing of the acquisition triggering, “trigger desensitizing” is performed. Trigger desensitizing is accomplished using an initial adiabatic half-passage (AHP) to prepare the magnetization in a consistent way (i.e., by nulling magnetization) immediately after the trigger. After a subsequent recovery period that remains constant, a second AHP is used to excite magnetization as the double spin-echo sequence begins. The FOV in the phase-encoded directions (y and z) is reduced using slice-selective 180° pulses of the hyperbolic secant (HS) type. The first echo, at 35 ms, is a non-phase encoded navigator echo. A BIR4 pulse is then used to generate a second echo at 52 ms which is phase encoded and used to reconstruct images. The lengths of the AHP, HS, and BIR4 pulses are 3, 2, and 2 ms, respectively. The bandwidth of the HS pulse is 10 kHz. The traces labeled AM and FM show the amplitude- and frequency-modulated functions of the adiabatic RF pulses, respectively. Gradient pulses used to spoil transverse magnetization are shown in gray. Gradient pulses used for 3D imaging are shown in dark gray.
Figure 3
Figure 3. Effect of Variable Slice Thickness
Ex vivo coronal T2-weighted MR images of a 26 month old transgenic mouse with slice thicknesses of 60, 90, 120, 180, and 270 μm. All other parameters were held constant: in plane resolution 60 μm × 60 μm, TR = 2 s, TE = 52 ms, BW = 44 kHz. Plaque sharpness begins to fall off at slice thickness >120 μm.
Figure 4
Figure 4. Trigger Desensitizing Sequence Modification
(A) and (B) are in vivo, (C) and (D) are spatially matched ex vivo images from a 24 month AD transgenic mouse. (A) and (C) are full FOV and (B) and (D) illustrate a magnified sub-sampled area of the parent image to its left. The arrows (–12) point to spatial coordinate positions in the common space of the spatially registered in vivo and ex vivo image volumes using a linked cursor system. (C) Scale bar = 500 μm. (D) Scale bar = 200 μm. Plaques are not resolved as clearly in vivo as ex vivo. However, images obtained with the trigger desensitizing sequence modification, illustrated in Fig 2, are consistently adequate for resolving individual plaques.
Figure 5
Figure 5. Three- way correlation in a 26 month AD mouse
Panels A, C, and E are full FOV and panels B, D, and F illustrate a magnified sub-sampled area centered on the hippocampus, of the parent image to its left. The numbered arrows point to identical spatial coordinate positions in the common space of the three spatially registered volumes (in vivo, ex vivo, histological) using a linked cursor system. Spatially matched in vivo (A,B), ex vivo (C,D), and histological sections (E,F) conclusively demonstrate that the dark areas seen in vivo do indeed represent plaques. (E) Scale bar = 500 μm. (F) Scale bar = 200 μm. Plaque sharpness in vivo approaches, but is clearly inferior to that obtained on ex vivo MRI.
Figure 6
Figure 6. Three- way correlation in a 24 month wild type mouse
Spatially matched in vivo (A), ex vivo (B), and histological sections (C) in a 24 month wild type mouse demonstrate no dark spots on MRI and no plaques on histology. Comparison of these images with those of AD transgenic mice of approximately the same age in Figs 4 and 5 confirm that dark areas seen on in vivo MRI in AD transgenic mice represent plaques and not simply mottling due to image noise. (C) Scale bar = 500 μm.
Figure 7
Figure 7. Spin Echo Vs T2* Gradient Echo Plaque Contrast
In vivo MRI of a 20 month AD mouse, (A – C) a spin echo and (D– F) a T2* gradient echo image at the same anatomic position. Spatial resolution was identical between the two acquisitions (60 μm × 60 μm in plane and 120 μm through plane). Panels (B) and (E), centered on the cortex, are magnified from the corresponding parent image in (A) and (D) respectively. The size of the largest plaque in the cortex (arrow 1) is considerably larger on the T2* (E) than the spin echo image (B). However the smaller plaques indicated by arrows in (B), are clearly visible on the spin echo and are barely perceptible on the corresponding T2* gradient echo scan (E). Panels (C) and (F), centered on the striatum, are magnified from the corresponding parent image in (A) and (D) respectively. Note that plaques (circled) in the striatum that are distinctly resolved on the spin echo image (C), are blurred into a “single” dark spot on the T2* image (F).
Figure 8
Figure 8. Thio-S and Iron stained sections in AD mouse
The same section was sequentially stained with Prussian Blue for iron (left) and Thio-S (right.) in a 24 month old transgenic mouse. Mean plaque size on Thio-S is fairly uniform through the brain, in particular no obvious difference in size is seen between plaques in the striatum vs. those in the cortex and hippocampus. In contrast, the iron content of striatal plaques is far greater than plaques in the cortex and hippocampus where Prussian blue staining is imperceptible.

References

    1. Evans DA, Funkenstein HH, Albert MS. Prevalence of Alzheimer’s disease in a community population of older persons. JAMA. 1989;262:2551–2556. - PubMed
    1. McKhann G, Drachman D, Folstein M, Katzman R, Price D, Stadlan EM. Clinical diagnosis of Alzheimer’s disease: report of the NINCDS-ADRDA work group under the auspices of Department of Health and Human Services Task Force on Alzheimer’s disease. Neurology. 1984;34:939–944. - PubMed
    1. Growdon JH. Biomarkers of Alzheimer disease. Arch Neurol. 1999;56:281–283. - PubMed
    1. Hardy J, Selkoe DJ. The amyloid hypothesis of Alzheimer’s disease: progress and problems on the road to therapeutics. Science. 2002;297:353–356. - PubMed
    1. Hsiao K, Chapman P, Nilsen S, Eckman C, Harigaya Y, Younkin D, Yang F, Cole GM. Correlative memory deficits, Aβ elevation, and amyloid plaques in transgenic mice. Science. 1996;274:99–102. - PubMed

Publication types