. 2005 Feb;16(2):676-88.
doi: 10.1091/mbc.e04-07-0544. Epub 2004 Nov 24.

Quantitative imaging of single live cells reveals spatiotemporal dynamics of multistep signaling events of chemoattractant gradient sensing in Dictyostelium

Affiliations

Quantitative imaging of single live cells reveals spatiotemporal dynamics of multistep signaling events of chemoattractant gradient sensing in Dictyostelium

Xuehua Xu et al. Mol Biol Cell. 2005 Feb.

Abstract

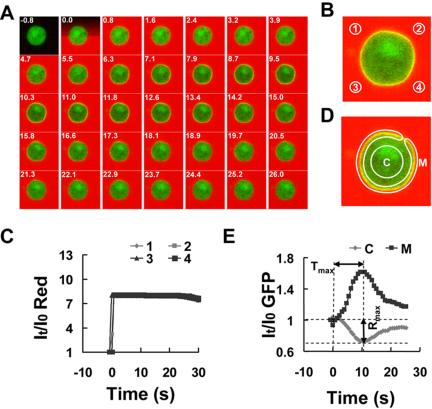
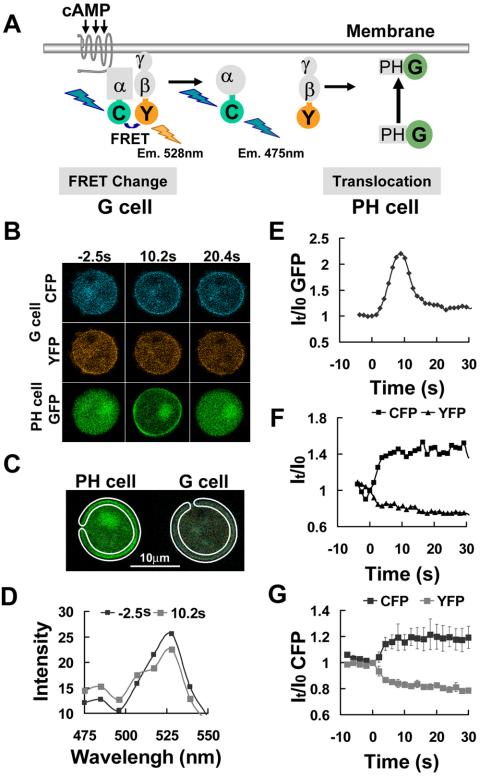
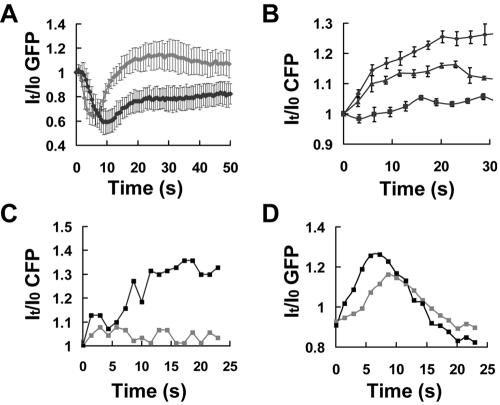
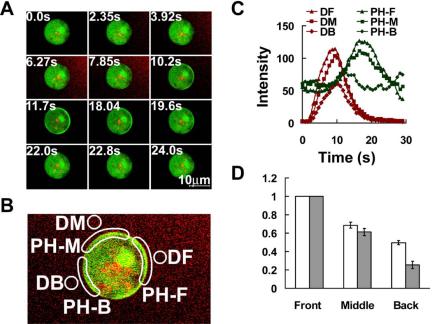
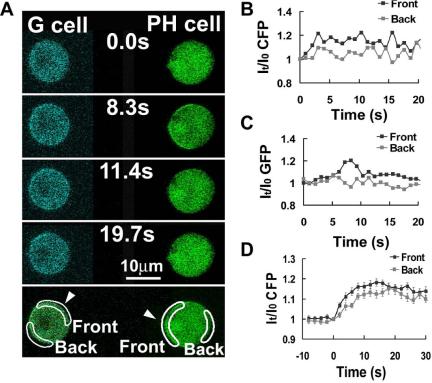
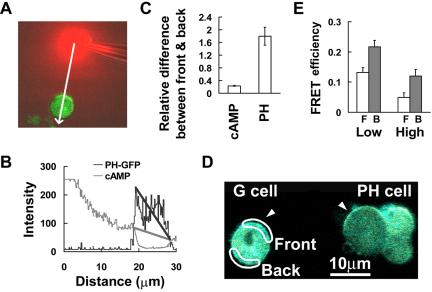
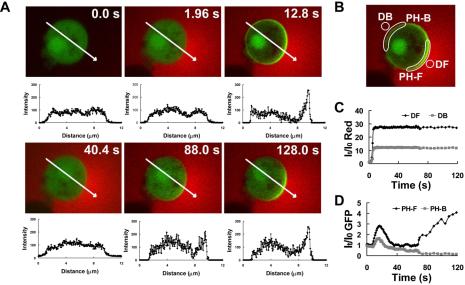
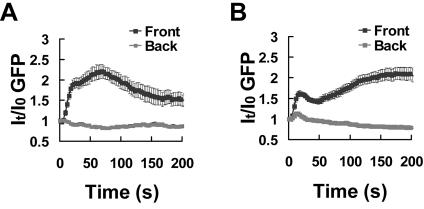
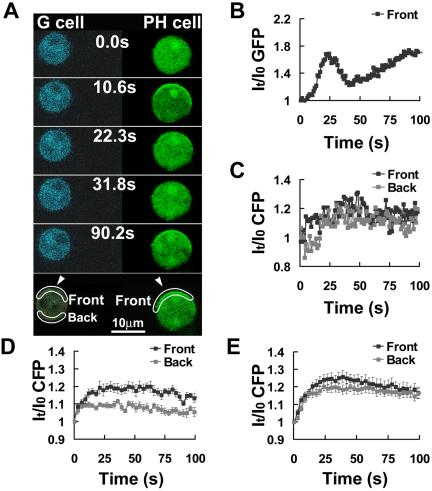
Activation of G-protein-coupled chemoattractant receptors triggers dissociation of Galpha and Gbetagamma subunits. These subunits induce intracellular responses that can be highly polarized when a cell experiences a gradient of chemoattractant. Exactly how a cell achieves this amplified signal polarization is still not well understood. Here, we quantitatively measure temporal and spatial changes of receptor occupancy, G-protein activation by FRET imaging, and PIP3 levels by monitoring the dynamics of PH(Crac)-GFP translocation in single living cells in response to different chemoattractant fields. Our results provided the first direct evidence that G-proteins are activated to different extents on the cell surface in response to asymmetrical stimulations. A stronger, uniformly applied stimulation triggers not only a stronger G-protein activation but also a faster adaptation of downstream responses. When naive cells (which have not experienced chemoattractant) were abruptly exposed to stable cAMP gradients, G-proteins were persistently activated throughout the entire cell surface, whereas the response of PH(Crac)-GFP translocation surprisingly consisted of two phases, an initial transient and asymmetrical translocation around the cell membrane, followed by a second phase producing a highly polarized distribution of PH(Crac)-GFP. We propose a revised model of gradient sensing, suggesting an important role for locally controlled components that inhibit PI3Kinase activity.


Figures

Figure 1.
Figure 1.
Membrane translocation of PHCrac-GFP in a living cell exposed to a uniform chemoattractant field. (A) PHCrac-GFP translocation (green) after exposure to a uniform field of cAMP chemoattractant (red). A cell expressing PHCrac-GFP (PH cell) was stimulated with 10 nM cAMP at time 0. The stimulation was imaged and quantified by inclusion of a fluorescence dye, Alexa 594, in the cAMP solution. Time (seconds) after cAMP exposure is shown in the top left corner of each image. Supplementary Figure 1 and Supplementary Video video1.avi show a complete sequence of GFP and Alexa intensity changes. Images were captured at 0.8-s intervals and replayed at 5 frames/s. (B) Regions of interest (1-4) used to assess concentration changes of cAMP with time in the vicinity of the cell. (C) Quantitative measurement over time of the increase in cAMP in the four regions of interest. (D) Regions of interest designated as the membrane (M) and the cytosol (C) of the cell and used for assessing cAMP-triggered redistribution of PHCrac-GFP, detected as intensity changes of green fluorescence within a specified region. (E) PHCrac-GFP membrane translocation between the cytosol (C) and membrane (M) over time after exposure to a uniform field of chemoattractant. Similar results were observed in more than 20 independent experiments.
Figure 2.
Figure 2.
Single-cell FRET measurement of heterotrimeric G-protein dissociation in a uniform cAMP field. (A) Diagram shows how G-protein dissociation induced by cAMP binding to the receptor can be monitored by the loss of FRET between CFP and YFP tagged to the Gα and Gβ subunits, respectively. It also shows the membrane translocation of PHCrac-GFP to monitor cAMP stimulation. (B) cAMP, 1 μM, was uniformly applied at time 0. Fluorescence images of cAMP-triggered G-protein dissociation in the G cell and PHCrac-GFP translocation in the PH cell. Increased CFP and decreased YFP signal intensities around the G cell membrane at 10.2 and 20.4 s indicate G-protein subunit dissociation that simultaneously reduces quenching of CFP and excitation of YFP. Transient PHCrac-GFP translocation to all regions of the plasma membrane was clearly observed at 10.2 s in a nearby PH cell. Supplementary Videos video2.avi and video3.avi show the full time course of CFP and YFP intensity changes in a single living cell after cAMP stimulation, respectively. Images were captured at 1.1-s intervals and are replayed at five frames/s. (C) Regions of interest used for quantitative analysis of G-protein activation and membrane translocation of PHCrac-GFP in a uniform field of cAMP. (D) Combined emission spectra of the membrane region of the G cell before and after the addition of cAMP at time 0. On uniform stimulation with cAMP, a significant increase in the CFP emission signal near 475 nm and a reciprocal decrease in the YFP emission near 528 nm were observed, consistent with a loss of FRET upon subunit dissociation. (E) Temporal changes in membrane associated PHCrac-GFP after exposure of the cell to the same uniform field of cAMP. (F) Temporal changes in the G-protein dissociation at the cell membrane after stimulation, reflected as a CFP (M-CFP, black) signal intensity increase and a paralleled YFP (M-YFP, gray) signal decrease. (F) Uniformly applied cAMP stimulation triggered G-protein dissociation, reflected as CFP signal intensity increase and YFP signal decrease. Means and SEs for each time points are shown as temporal changes in the G-protein dissociation at the membrane after stimulation by 2 μM cAMP (n = 6).
Figure 3.
Figure 3.
Concentration-dependent changes in the rate of PHCrac-GFP recruitment to the membrane and G-protein activation. (A) The kinetics of intensity changes in cytosolic PHCrac-GFP pools in response to two doses of cAMP stimulation. Means and SDs for each time point are shown as temporal changes in cytosolic PHCrac-GFP in response to a high-dose (1 μM, gray line, n = 6) and a low-dose (10 nM, black line, n = 8) cAMP stimulation. (B) Dose-dependent G-protein activation. Means ± SE are shown as temporal changes in the G-protein dissociation at the cell membrane after stimulation by 1 nM (▪, n = 6), 100 nM (▴, n = 3), and 10 μM (•, n = 5). (C) and (D) One PH and one G cell were first stimulated with 1 nM cAMP and then exposed to 100 nM cAMP. Before the second stimulation, the cells were washed with buffer to remove previously added cAMP and were allowed to recover for 10 min. (C) The graph shows CFP intensity changes on the membrane after stimulation with a low dose (1 nM, gray) or a high dose (100 nM, black) of cAMP. (D) PHCrac-GFP association with the entire cell surface membrane in response to a low dose (1 nM, gray) and a high dose (100 nM, black). Similar results were obtained in more than 10 experiments (another example is shown in Supplementary Figure S1, B and C).
Figure 4.
Figure 4.
PHCrac-GFP translocation in response to acute exposure to a cAMP gradient. (A) A pulse of cAMP was released by applying a pressure increase from a nearby micropipette and sequential fluorescence images were captured to monitor PHCrac-GFP distribution and cAMP concentration represented as Alexa 594 intensity. Numbers in the top left corner are seconds after cAMP release of the selected frames. Supplementary Video video5.avi presents the complete sequence from this experiment. Frames were captured at 785-ms intervals and are replayed at five frames/s. (B) DF, DM, and DB represent the selected front, middle, and back regions surrounding the cell used for quantitative measurement of dynamic changes of cAMP concentration. PH-F, PH-M, and PH-B show the membrane regions for measuring PHCrac-GFP translocation responses to this asymmetrical cAMP stimulation. (C) Time course of changing cAMP concentration and of membrane translocation of PHCrac-GFP in the different regions of a cell. (D) Quantitative analyses of the relationship between the peak value of cAMP stimulation and the peak value of the PHCrac-GFP membrane association in each region of response of PHCrac-GFP translocation was normalized by dividing the peak value of PH-F, the maximal local response. Data were obtained from 16 independent experiments. Means ± SE are shown.
Figure 5.
Figure 5.
G-protein dissociation in the front and back regions of cells in response to an acute exposure to a cAMP gradient. (A) G-protein dissociation in a single living cell upon an acute stimulation by a directional source of cAMP. Only CFP images of the G cell are shown. (B) G-protein dissociation over time in the front and back regions of the G cell, expressed as a ratio of the CFP signal at each time point to the CFP signal at time 0. (C) Temporal changes in PHCrac-GFP translocation to the front side of the cell. Similar results were obtained in eight experiments. (D). Kinetics of G-protein dissociation in the front and back regions of cells upon stimulation of a cAMP wave. Cells were stimulated by a cAMP wave at 0 s. Time course of G-protein dissociation, expressed as a ratio of the CFP signal at each time point to the CFP signal at 0 s, are shown as means ± SE (n = 22) at each time point.
Figure 6.
Figure 6.
Asymmetrical subcellular distributions of PHCrac-GFP and inactive G-protein heterotrimers in a nonpolarized cell exposed to a steady cAMP gradient. (A) PHCrac-GFP distribution in a cell exposed to a steady cAMP gradient visualized as the red Alexa 594 fluorescence signals. (B) Quantitative measurement of the cAMP gradient and intracellular distribution of PHCrac-GFP along the line starting from the position of the dispensing micropipette and through the central part of the cell in A. The gray line reflects the relative concentration of cAMP. Assuming the maximal intensity equals 1 μM cAMP, we estimated that the concentration is ∼320 nM at the front side and 240 nM at the back side of the cell. The black line plots the PHCrac-GFP distribution from the front to the back side of the cell. These results are typical of six experiments. (C) Membrane-associated PHCrac-GFP at the front and back regions of nonpolarized cells in response to the difference in cAMP concentration (cAMP). cAMP concentration (cAMP) and membrane associated PHCrac-GFP in the front and back regions of nonpolarized cells were directly measured from six independent experiments. (D) G and PH cell images in a steady gradient. The selected front and back regions for FRET measurement of the distribution of inactive heterotrimeric G-proteins are shown. The entire area of the G cell was illuminated to photobleach YFP, and FRET was monitored as increased CFP emission in the selected front and back regions after photobleaching. FRET efficiency was calculated as [IntensityCFP(post) - IntensityCFP(pre)]/IntensityCFP(post). (E) FRET efficiency that reflects the proportion of inactive G-proteins in the front and back regions of cells in steady gradients with similar steepness (∼20%) but different cAMP concentrations. Means and SEs of FRET efficiency show the proportion of inactive G-proteins in the back (▪) is higher than that in the front (□) in response to both low (1 μM cAMP in the micropipette, n = 16 and p < 0.002) and high (3 μM in the micropipette, n = 21 and p < 0.002) cAMP concentration.
Figure 7.
Figure 7.
Dynamics of PHCrac-GFP translocation in a cell suddenly exposed to a static cAMP gradient. (A) A PH cell (green) is exposed to a sudden gradient (red). Membrane translocation of PHCrac-GFP shows a peak, then a decline, and a second peak. Green fluorescence intensity along the white line across the cell is shown under each image, indicating the distribution of PHCrac-GFP in the cell. Images were captured at 0.96-s intervals, and the frames at selected time points are shown here. (B) Front (DF) and back (DB) regions used to evaluate quantitative changes of Alexa 594 fluorescence intensity as a measure of cAMP concentration. PH-F and PH-B were selected membrane regions used for monitoring the response of PHCrac-GFP translocation to the front and back of the cell relative to the cAMP gradient, respectively. (C) Rapid generation of a stable cAMP gradient. (D) Dynamic changes in PHCrac-GFP membrane translocation at the front (PH-F) and the back (PH-B) sides of the cell. The slight decrease of GFP intensity over time is caused by photobleaching. Data are representative of nine experiments. Supplementary Video video6.avi shows a full set of images from one of nine experiments.
Figure 8.
Figure 8.
Kinetics of PHCrac-GFP membrane translocation in the front and back of cells when they were suddenly exposed to stable cAMP gradients with similar steepness but different cAMP concentrations. (A) and (B) Naive cells were suddenly exposed to a stable gradient of a low and a high concentration of cAMP, respectively. Micropipettes filled with 100 nM or 1 μM of cAMP were moved from far to near the cells at 0 s. Dynamics changes in membrane associated PHCrac-GFP in the front and back regions of cells are shown as means ± SE (n = 26 and 23 for A and B, respectively).
Figure 9.
Figure 9.
G-protein activation after a sudden exposure to a steady cAMP gradient. (A) Comparison of G-protein activation (CFP images) and PHCrac-GFP translocation. Frames were captured at 1.06-s intervals and selected frames were shown. Regions of interest for the data reported in B and C are also shown. (B) Dynamics of the PHCrac-GFP membrane association in the front of the PH cell. (C) G-protein activation in the front (black) and back (gray) of the G cell, measured as the increase of CFP intensity. Similar results were obtained five times. (D) and (E) Kinetics of G-protein dissociation in the front and back of cells in response to cAMP gradients with different steepness but similar cAMP concentration in the front of the cells. Micropipette filled with 1 or 3 μM of cAMP was moved from 1500 μm away to ∼10 μm (D) or 50 μm (E) from the cells at 0 s. These movement generated gradients with similar cAMP concentration in the front of the cells but different steepness of ∼100% (D) or 20% (E), respectively, which were estimated from the measurement of a stable gradient shown in Supplementary Figure S2. G-protein activation in the front (black) and back (gray) of G cells, measured as the increase of CFP intensity, are shown. Means ± SE of each time point (n = 10 and 18 for D and E, respectively) are shown as temporal changes in the G-protein dissociation in the front and back after stimulation. To estimate the relative difference in G-protein activation, after reaching the steady states, between the front and back side of cells, we first calculated Means, ∑It/I0CFP/n, where n is the number of the time points; the first time point is 27s and the last time point is 100 s. (D) 118.4 ± 1.3% (front) and 108 ± 1.7% (back); (E) 121.5 ± 2.7% (front) and 118 ± 1.4% (back). Relative difference in D: (118.4% - 1)/(108% - 1) - 1 = 130%; in E: (121.5% - 1)/(118% - 1) - 1 = 19.3%.

Similar articles

Cited by

References

    1. Adams, S. R., Harootunian, A. T., Buechler, Y. J., Taylor, S. S., and Tsien, R. Y. (1991). Fluorescence ratio imaging of cyclic AMP in single cells. Nature 349, 694-697. - PubMed
    1. Butty, A. C., Perrinjaquet, N., Petit, A., Jaquenoud, M., Segall, J. E., Hofmann, K., Zwahlen, C., and Peter, M. (2002). A positive feedback loop stabilizes the guanine-nucleotide exchange factor Cdc24 at sites of polarization. EMBO J. 21, 1565-1576. - PMC - PubMed
    1. Chung, C. Y., Funamoto, S., and Firtel, R. A. (2001). Signaling pathways controlling cell polarity and chemotaxis. Trends Biochem. Sci. 26, 557-566. - PubMed
    1. Comer, F. I., and Parent, C. A. (2002). PI 3-kinases and PTEN: how opposites chemoattract. Cell 109, 541-544. - PubMed
    1. Devreotes, P., and Janetopoulos, C. (2003). Eukaryotic chemotaxis: distinctions between directional sensing and polarization. J. Biol. Chem. 278, 20445-20448. - PubMed

MeSH terms