. 2005 Jan 15;562(Pt 2):477-91.
doi: 10.1113/jphysiol.2004.075622. Epub 2004 Nov 25.

Volume sensitivity of the bestrophin family of chloride channels

Affiliations

Volume sensitivity of the bestrophin family of chloride channels

Rodolphe Fischmeister et al. J Physiol. .

Abstract

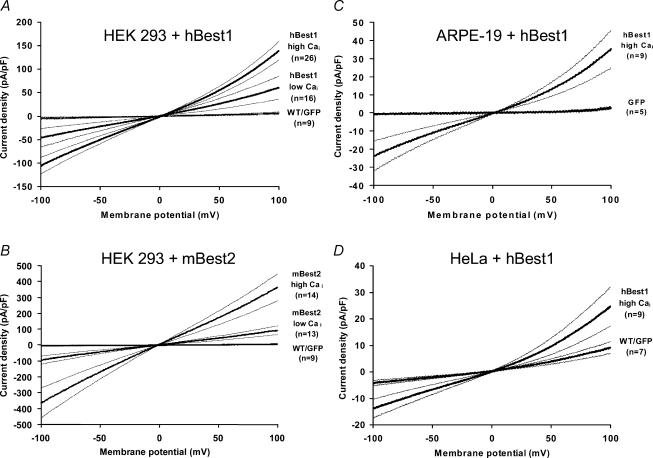
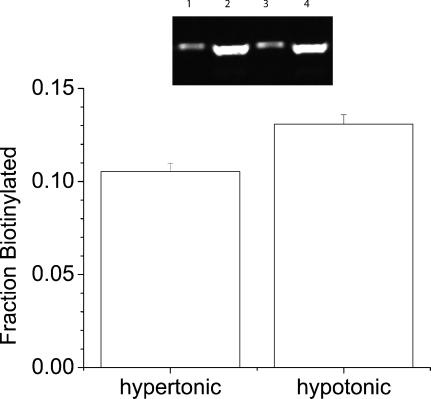
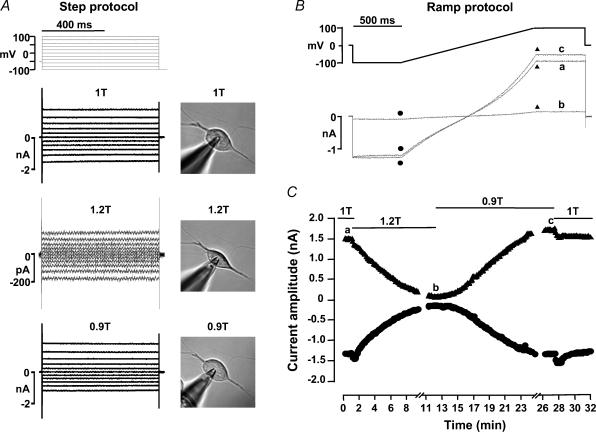
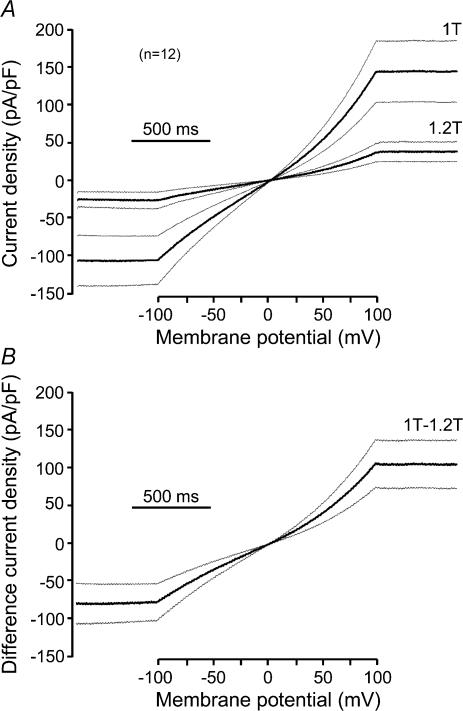
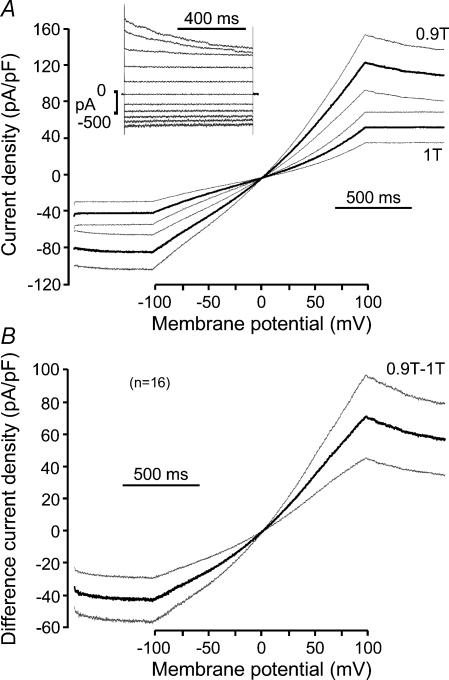
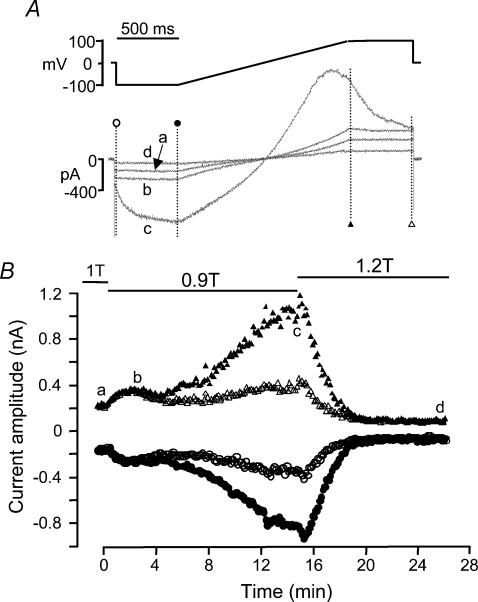
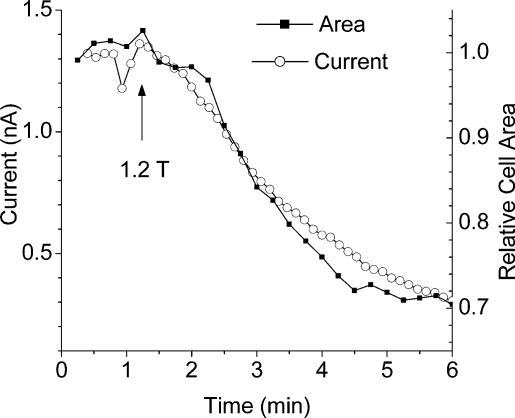
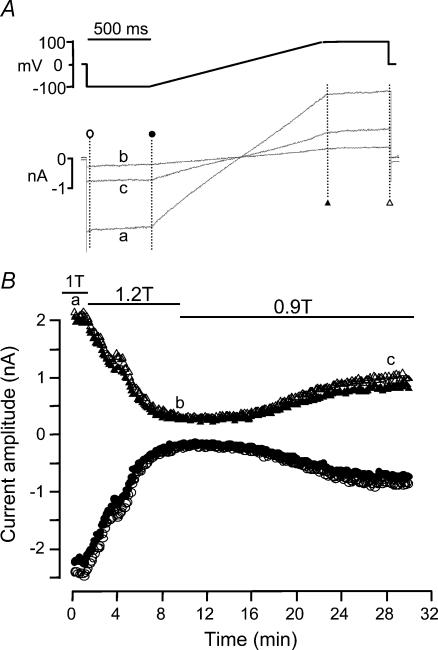
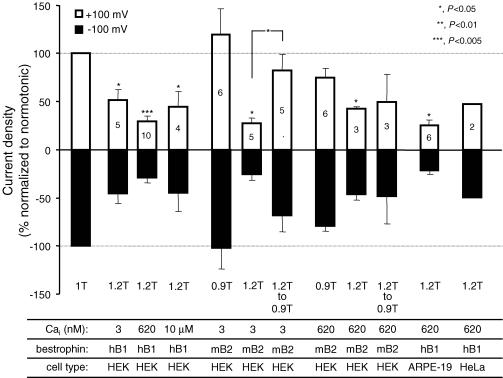
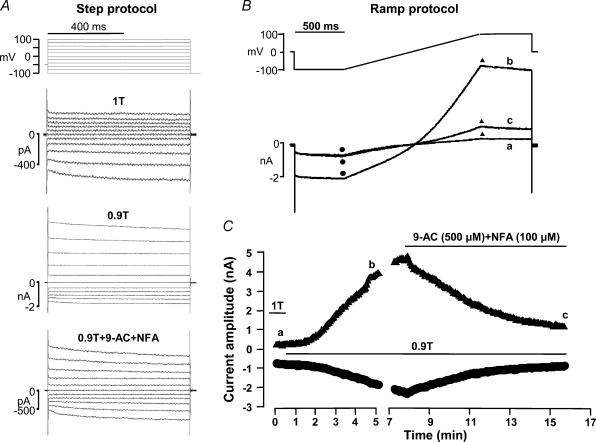
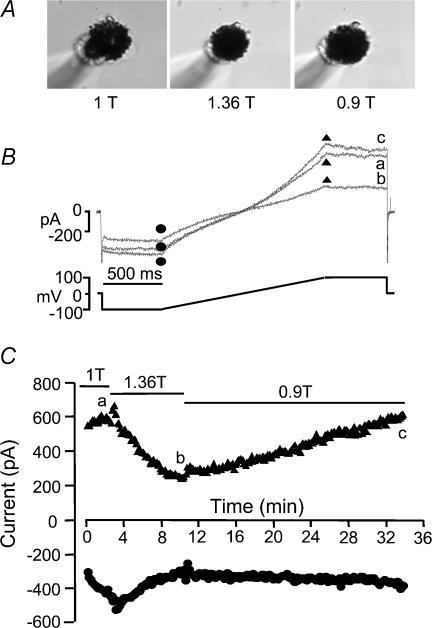
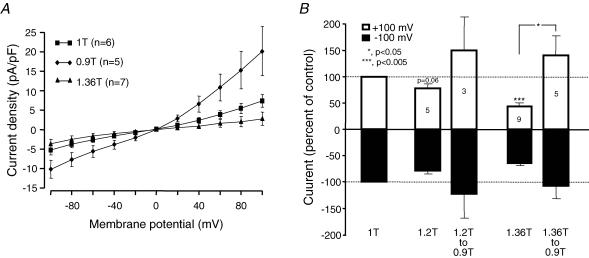
Bestrophins are a newly identified family of Cl(-) channels. Mutations in the founding member of the family, human bestrophin-1 (hBest1), are responsible for a form of early onset macular degeneration called Best vitelliform macular dystrophy. The link between dysfunction of hBest1 and macular degeneration remains unknown. Because retinal pigmented epithelium (RPE) cells may be subjected to varying osmotic pressure due to light-dependent changes in the ionic composition of the subretinal space and because RPE cells may undergo large volume changes during phagocytosis of shed photoreceptor discs, we investigated whether bestrophin currents were affected by cell volume. When hBest1 and mBest2 were overexpressed in HEK 293, HeLa, and ARPE-19 cells, a new Ca(2+)-activated Cl(-) current appeared. This current was very sensitive to cell volume. A 20% increase in extracellular osmolarity caused cell shrinkage and a approximately 70-80% reduction in bestrophin current. Decreases in extracellular osmolarity increased the bestrophin currents slightly, but this was difficult to quantify due to simultaneous activation of endogenous volume-regulated anion channel (VRAC) current. To determine whether a similar current was present in mouse RPE cells, the effect of hyperosmotic solutions on isolated mouse RPE cells was examined. Mouse RPE cells exhibited an endogenous Cl(-) current that resembled the expressed hBest1 in that it was decreased by hypertonic solution. We conclude that bestrophins are volume sensitive and that they could play a novel role in cell volume regulation of RPE cells.


Figures

Figure 1
Figure 1. Expression of hBest1 and mBest2 in various cell lines
Average current–voltage (I–V) relationships (thick lines) ± s.e.m. (thin lines) obtained with slow ramp protocols (see Methods) in HEK 293 cells transfected with either EGFP alone or EGFP + hBest1 (A), EGFP alone or EGFP + mBest2 (B), in ARPE-19 cells transfected with either EGFP alone or EGFP + hBest1 (C), and in HeLa cells transfected with either EGFP alone or EGFP + hBest1 (D). For each cell, currents were normalized to cell membrane capacitance to produce current density (in pA pF−1).
Figure 2
Figure 2. hBest1 is expressed on the cell surface
Transiently transfected HEK 293 cells were biotinylated as described in Methods. Inset: Western blot. Cells were bathed in hypotonic medium (lanes 1 and 2) or hypertonic medium (lanes 3 and 4). Lanes 1 and 3 are biotinylated hBest1. Lanes 2 and 4 are nonbiotinylated. The fraction of hBest1 biotinylated by cell surface biotinylation reagent is quantified in the graph (mean of three experiments).
Figure 3
Figure 3. Effect of hyperosmotic cell shrinkage on hBest1 currents in HEK 293 cells
The patch pipette contained high Cai solution. A, individual current traces obtained in response to the step protocol indicated on top. Top traces: normosmotic, 1T. Middle traces: hyperosmotic, 1.2T. Bottom traces: hyposmotic, 0.9T. Corresponding changes in cell volume are illustrated by the micrographs. B, ramp protocol and corresponding current traces. C, time course of the current amplitudes at −100 mV (•) and +100 mV (▴) in response to hyperosmotic shrinkage and hyposmotic swelling. The cell was exposed to normosmotic (1T), hyperosmotic (1.2T), hyposmotic (0.9T) and normosmotic solutions as indicated by the solid lines in C. The individual current traces in B were obtained at times indicated by the corresponding letters in C. Cell membrane capacitance was 11.3 pF.
Figure 4
Figure 4. Effect of hyperosmotic cell shrinkage on hBest1 currents in HEK 293 cells
A, average current traces (thick lines, normalized to cell membrane capacitance) and s.e.m. (thin lines) of 12 HEK 293 cells transfected with EGFP + hBest1 and exposed first to normosmotic 1T and subsequently to hyperosmotic 1.2T solutions during the standard ramp protocol. The cells were whole-cell voltage clamped with high Cai in the patch pipette. The x axis indicates the changes in membrane potential during the ramp protocol. B, average current difference (thick line) and s.e.m. (thin line) for the two conditions shown in A.
Figure 5
Figure 5. Effect of hyposmotic cell swelling on hBest1 currents in HEK 293 cells
A, Average current traces (thick lines, normalized to cell membrane capacitance) and s.e.m. (thin lines) of 16 HEK 293 cells transfected with EGFP + hBest1 and exposed first to normosmotic 1T and subsequently to hyposmotic 0.9T solutions during the standard ramp protocol. The cells were whole-cell voltage clamped with high Cai in the patch pipette. The x axis indicates the changes in membrane potential during the ramp protocol. The inset shows individual current traces obtained for one of these cells in response to the step protocol described in Fig. 1A. B, average current difference (thick line) and s.e.m. (thin line) for the two conditions shown in A.
Figure 6
Figure 6. Effect of hyposmotic cell swelling on hBest1 currents in HEK 293 cells
The patch pipette contained low Cai. A, ramp protocol and current traces at times indicated by the corresponding letters in B. B, time course of the current amplitudes at −100 mV (circles) and +100 mV (triangles) to hyperosmotic shrinkage and hyposmotic swelling at times indicated by the corresponding symbols in A. The cell was first exposed to normosmotic (1T) solution, and then to hyposmotic (0.9T) and hyperosmotic (1.2T) solutions as indicated by the solid lines. Cell membrane capacitance was 22.0 pF.
Figure 7
Figure 7. Time course of change in cell volume and hBest1 current
Patch pipette contained high Cai. The cell was exposed to hyperosmotic (1.2T) solution at the arrow. Cell area was measured from high-resolution images and current amplitudes from voltage-clamp ramps.
Figure 8
Figure 8. Effect of osmolality on mBest2 currents in HEK 293 cells
The patch pipette contained high Cai. A, ramp protocol used and individual current traces obtained at times indicated by the corresponding letters in B. B, time course of current amplitudes at −100 mV (circles) and +100 mV (triangles) in response to hyperosmotic shrinkage and hyposmotic swelling at times indicated by the corresponding symbols in A. The cell was first exposed to normosmotic (1T) solution, and then to hyperosmotic (1.2T) and hyposmotic (0.9T) solutions as indicated by the solid lines. Cell membrane capacitance was 17.6 pF.
Figure 9
Figure 9. Summary of the effects of cell volume changes on hBest1 and mBest2 currents
Cells were exposed to normosmotic solution (1T) and bestrophin current density was recorded at −100 mV (bottom histograms) or +100 mV (top histograms). The cells were subsequently exposed to either hyperosmotic (1.2T) or hyposmotic (0.9T) solutions, and the changes in current densities were normalized to that obtained in 1T (−100% at −100 mV; +100% at +100 mV). When indicated by 0.9T to 1.2T, the cells experienced a hyposmotic challenge after the initial hyperosmotic one. Summarized are experiments performed in: HEK 293 cells transfected with hBest1 + EGFP and whole-cell voltage clamped with 3 nm, 620 nm or 10 μm Cai; HEK 293 cells transfected with mBest2 + EGFP and with 3 nm or 620 nm Cai; HeLa and ARPE-19 cells transfected with hBest1 + EGFP and with 620 nm Cai. The histograms show the means ± s.e.m. of the number of experiments indicated in the top histograms.
Figure 10
Figure 10. Effect of hyposmotic cell swelling on Cl current in mouse RPE cells
The patch pipette contained high Cai. A, current traces obtained in response to the step protocol indicated above the traces. Top traces: normosmotic, 1T. Middle traces: hyposmotic, 0.9T. Bottom traces: hyposmotic (0.9T) in presence of niflumic acid (NFA, 100 μm) and anthracene-9-carboxylic acid (9-AC, 500 μm). B, ramp protocol and current traces. C, time course of current amplitudes at −100 mV (circles) and +100 mV (triangles) in response to hyposmotic swelling and inhibition by NFA + 9-AC. The cell was first exposed to normosmotic (1T), and subsequently to hyposmotic (0.9T) conditions, without or with NFA (100 μm) and 9-AC (500 μm) as indicated by the solid lines in C. The current traces in B were obtained at times indicated by the corresponding letters in C. Cell membrane capacitance was 87.2 pF.
Figure 11
Figure 11. Effect of cell volume changes on Cl current in mouse RPE cells
The patch pipette contained high Cai. A, micrographs of the cell exposed to normosmotic (1T), hyperosmotic (1.36T) and hyposmotic (0.9T) solutions. B, ramp protocol and current traces. C, time course of the current response to hyperosmotic shrinkage and hyposmotic swelling. The cell was exposed to normosmotic (1T), hyperosmotic (1.36T), and hyposmotic (0.9T) solutions as indicated by the solid lines in C. The micrographs in A and the individual current traces in B were obtained at times indicated by the corresponding letters in C. Cell membrane capacitance was 110.9 pF.
Figure 12
Figure 12. Summary of the effects of cell volume changes on Cl currents in mouse RPE cells
A, current–voltage (I–V) curves for the Cl currents in isolated mouse RPE cells. Cells were first exposed to normosmotic solution (1T) and subsequently to either hyperosmotic (1.36T) or hyposmotic (0.9T) solutions. B, Cl current density was recorded at −100 mV (bottom histograms) or +100 mV (top histograms). In all experiments, the cells were first exposed to normosmotic solution (1T), then to hyperosmotic (1.2T or 1.36T) solutions, and finally some cells were exposed to hyposmotic solution (0.9T). The changes in current densities were normalized to that obtained in 1T (−100% at −100 mV; +100% at +100 mV). The histograms show the means ± s.e.m. of the number of expriments indicated in the top histograms. All experiments were performed with 620 nm Cai.

References

    1. Adorante JS. Regulatory volume decrease in frog retinal pigment epithelium. Am J Physiol Cell Physiol. 1995;268:C89–C100. - PubMed
    1. Altamirano J, Brodwick MS, Alvarez-Leefmans FJ. Regulatory volume decrease and intracellular Ca2+ in murine neuroblastoma cells studied with fluorescent probes. J Gen Physiol. 1998;112:145–160. 10.1085/jgp.112.2.145. - DOI - PMC - PubMed
    1. Bakall B, Marmorstein LY, Hoppe G, Peachey NS, Wadelius C, Marmorstein AD. Expression and localization of bestrophin during normal mouse development. Invest Ophthalmol Vis Sci. 2003;44:3622–3628. - PubMed
    1. Besharse JC. The daily light-dark cycle and rhythmic metabolism in the photoreceptor pigment epithelial complex. Prog Retinal Res. 1982;1:81–124.
    1. Caldwell GM, Kakuk LE, Griesinger IB, Simpson SA, Nowak NJ, Small KW, Maumenee IH, Rosenfeld PJ, Sieving PA, Shows TB, Ayyagari R. Bestrophin gene mutations in patients with Best vitelliform macular dystrophy. Genomics. 1999;58:98–101. - PubMed

Publication types

MeSH terms

LinkOut - more resources