

Review
doi: 10.1136/hrt.2004.043000.
Selection and optimisation of biventricular pacing: the role of echocardiography
Affiliations
- PMID: 15564419
- PMCID: PMC1876331
- DOI: 10.1136/hrt.2004.043000
Item in Clipboard
Review
Selection and optimisation of biventricular pacing: the role of echocardiography
Heart.
2004 Dec.
Abstract
The quantification of ventricular dyssynchrony is a key factor in identifying patients with severe heart failure who may benefit from cardiac resynchronisation with biventricular pacing (BVP). Echocardiographic techniques appear to offer superior sensitivity and specificity than the ECG in selecting these patients. This paper reviews the scope of current echocardiographic techniques for guiding both patient selection and optimisation of device programming following implantation.
Figures

M mode echocardiogram showing paradoxical left ventricular septal wall contraction and late systolic/early diastolic thickening of the posterior wall.

Reduction in regional ejection fraction (septal regions 2 and 3) on MUGA scan in the patient in fig 1.

Optimisation of atrioventricular delay. Left ventricular (LV) inflow pulsed wave Doppler at the level of mitral valve leaflets. (A) Atrioventricular (AV) delay 160 ms: uniphasic transmitral flow (fused E and A wave) with reduced left ventricular filling time (t) < 40% R-R interval. The onset of filling is delayed commencing after the end of the T wave on the ECG (white arrow). (B) AV delay 90 ms: mitral valve closure line coincides with the end of the A wave maximising LV filling time and restoring biphasic transmitral flow with E and A wave separation. (C) AV delay 70 ms: the end of the A wave is now truncated by mitral valve closure (seen arrowed and aliasing), with the commencement of mitral regurgitation and reduced LV filling time. AV optimisation can now be improved by increasing the AV delay in 10 ms increments until mitral valve closure line coincides with the end of the A wave without truncation.

Presystolic mitral regurgitation in the patient from fig 1. The arrow indicates the frame is acquired before onset of the QRS complex.

Aortic pre-ejection time (Ao) is measured as the time from QRS onset to blood flow. The time from the aortic valve opening to closure represents the ejection period (EP).
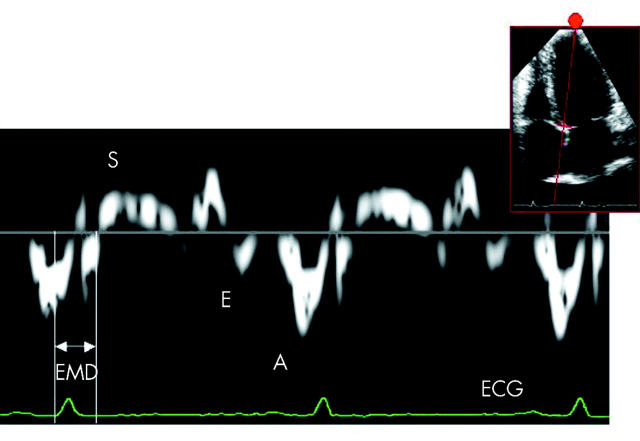
Pulsed wave tissue Doppler imaging of the basal interventricular septum acquired from an apical four chamber view. A broad complex QRS is seen. The upward deflection following QRS complex represents longitudinal shortening toward the transducer during ventricular systole (S wave). The two main deflections below the baseline represent E and A waves occurring during ventricular filling as the sampled region moves away from the transducer at the cardiac apex. The heights of S, E, and A waves (cm/s) measure the velocities of motion of the sampled region during systole and diastole respectively. Regional electromechanical delay (EMD) may be calculated from the start of QRS to the onset or peak of the S wave.
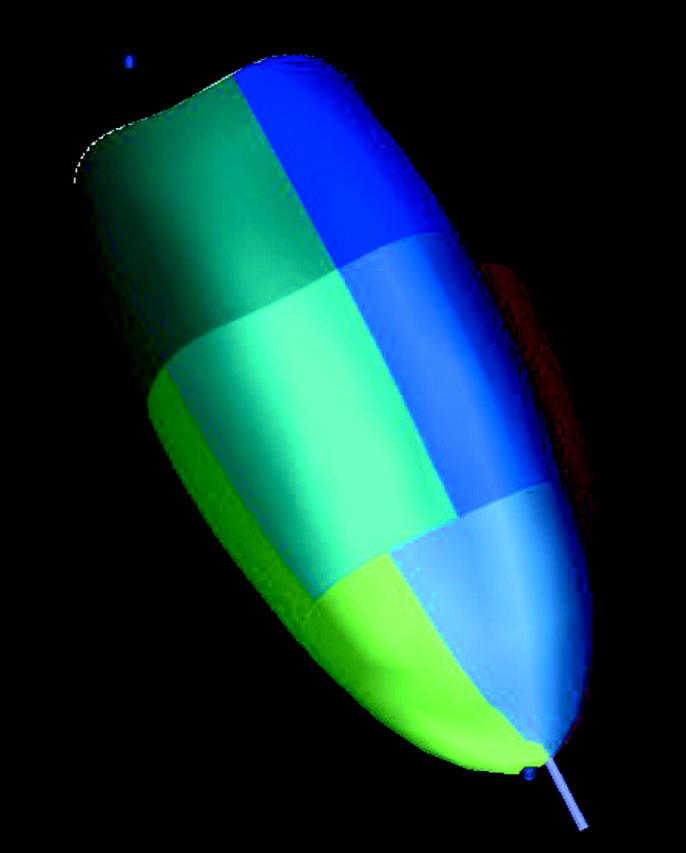
Three dimensional reconstruction of the left ventricle, which is divided into different regions. The timing of contraction and relaxation is assessed for each of these regions.

Echocardiographic assessment of left ventricular dyssynchrony. Each line represents movement of one of the left ventricular segments shown in fig 7. This ventricle contracts synchronously.

Echocardiographic assessment of left ventricular dyssynchrony. This shows an abnormal, dyssynchronous ventricle.

(A) LV velocity time integral (VTI) of 10.3 cm with an optimised AV delay at an interventricular pacing interval (IVPI) of 0 ms. (B) The same patient with an LV VTI of 12.9 cm at an IVPI delay of 20 ms (LV ahead of RV).
References
Publication types
MeSH terms
LinkOut - more resources
Full Text Sources
Medical