. 2004 Dec;78(24):13779-92.
doi: 10.1128/JVI.78.24.13779-13792.2004.

Intrahepatic gene expression during chronic hepatitis C virus infection in chimpanzees

Affiliations

Intrahepatic gene expression during chronic hepatitis C virus infection in chimpanzees

Catherine B Bigger et al. J Virol. 2004 Dec.

Abstract

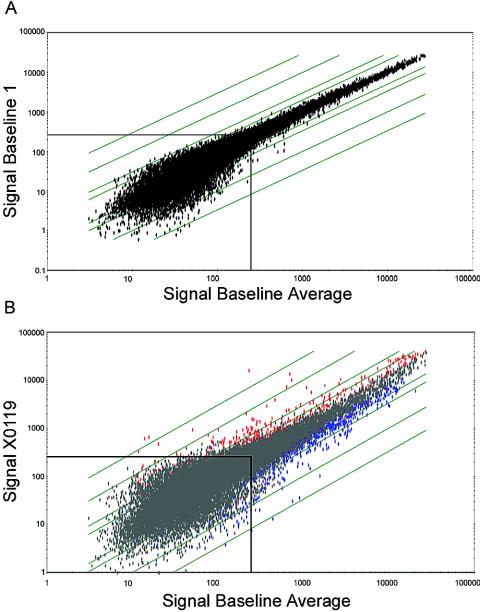
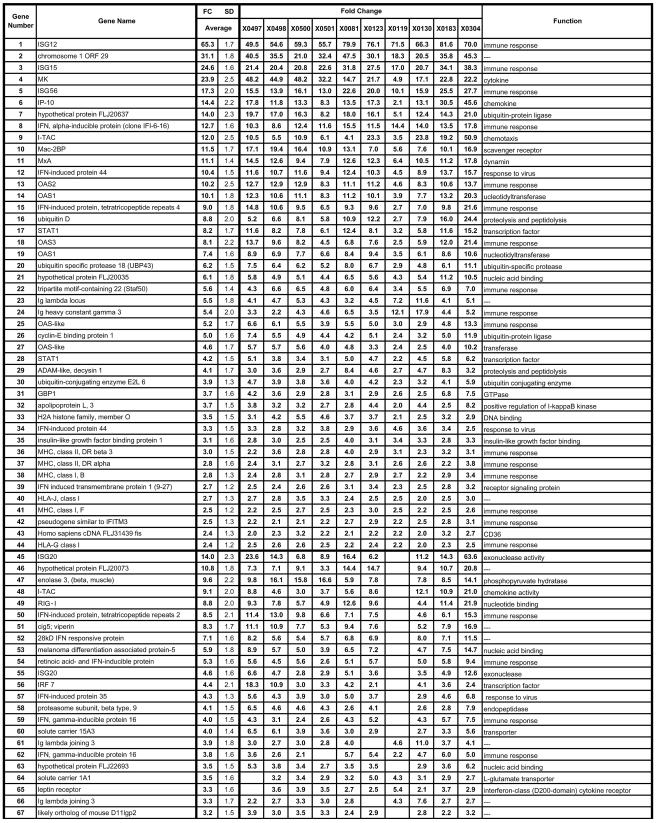
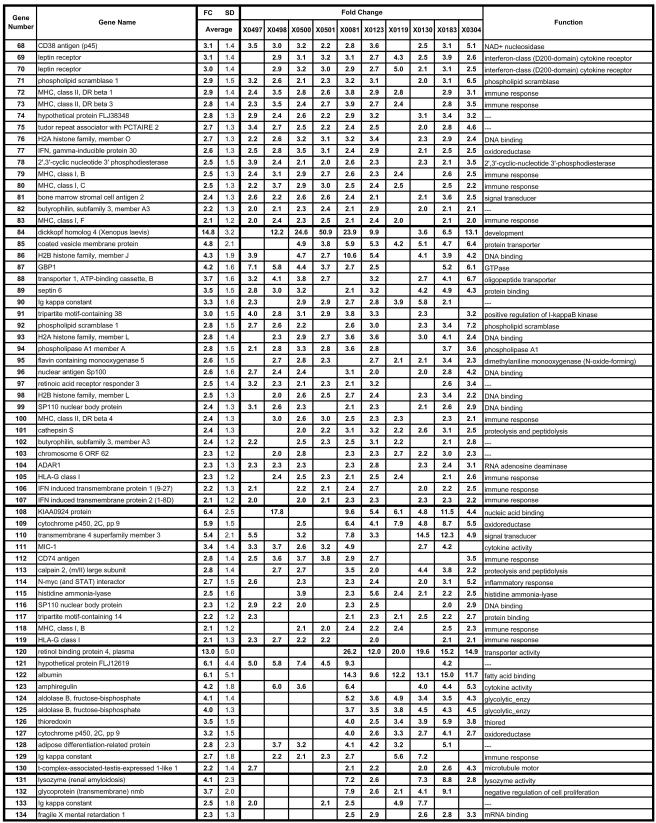
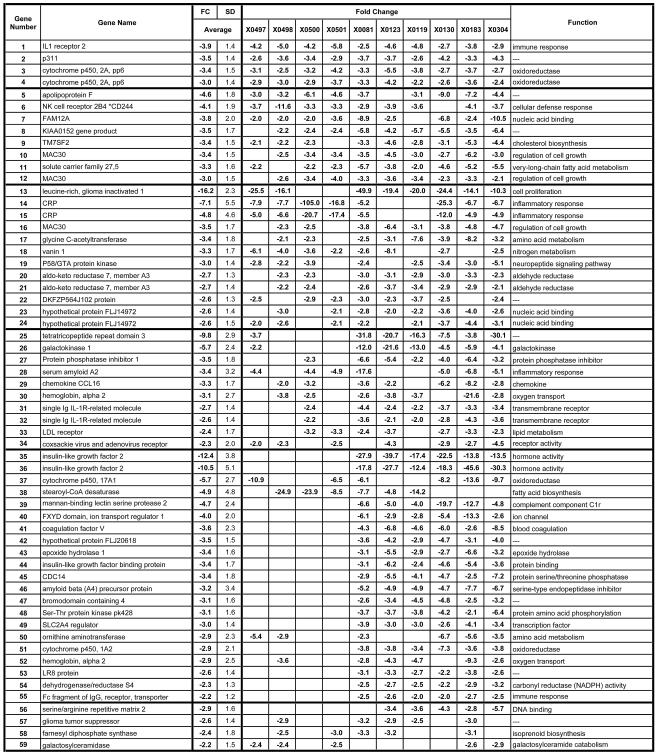
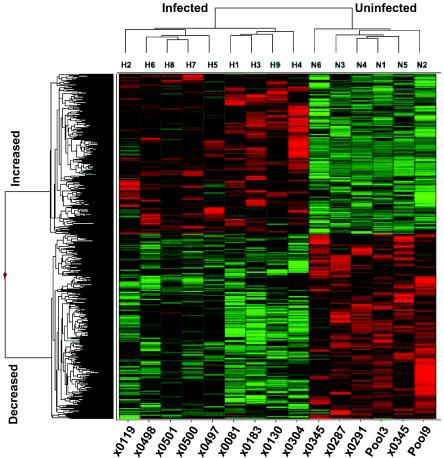
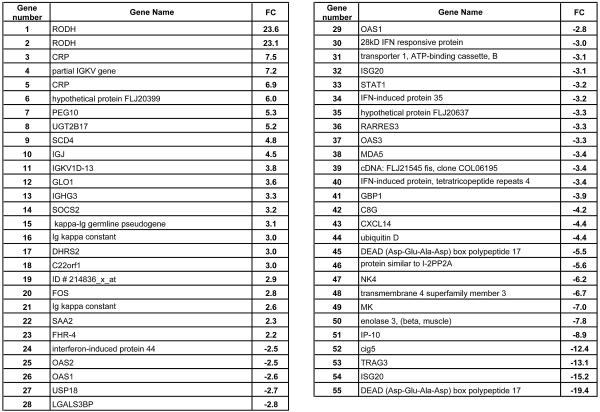
Hepatitis C virus (HCV) infections represent a global health problem and are a major contributor to end-stage liver disease including cirrhosis and hepatocellular carcinoma. An improved understanding of the parameters involved in disease progression is needed to develop better therapies and diagnostic markers of disease manifestation. To better understand the dynamics of host gene expression resulting from persistent virus infection, DNA microarray analyses were conducted on livers from 10 chimpanzees persistently infected with HCV. A total of 162 genes were differentially regulated in chronically infected animals compared to uninfected controls. Many genes exhibited a remarkable consistency in changes in expression in the 10 chronically infected animals. A second method of analysis identified 971 genes altered in expression during chronic infection at a 99% confidence level. As with acute-resolving HCV infections, many interferon (IFN)-stimulated genes (ISGs) were transcriptionally elevated, suggesting an ongoing response to IFN and/or double-stranded RNA which is amplified in downstream ISG expression. Thus, persistent infection with HCV results in a complex and partially predictable pattern of gene expression, although the underlying mechanisms regulating the different pathways are not well defined. A single genotype 3-infected animal was available for analysis, and this animal exhibited reduced levels of ISG expression compared to levels of expression with genotype 1 infections and increased expression of a number of genes potentially involved in steatosis. Gene expression data in concert with other observations from HCV infections permit speculation on the regulation of specific aspects of HCV infection.


Figures

FIG. 1.
FIG. 1.
Scatter plots of signal intensity comparisons of baselines and infected samples. (A) Log scale plot of signal intensities of genes hybridizing to the baseline 1 array compared to the average signal intensities of all six baselines. (B) Log scale plot of signal intensities of HCV-infected sample 4X0119 compared to the average signal intensities of the six baselines. The diagonal lines indicate changes of 2-, 5-, 10- and 30-fold. Genes with signal intensities below 250 exhibit considerably more scatter (boxed area). In the comparison of baseline samples (A), no significant variation occurs for genes with signal intensities of >250. In contrast, in the comparison of infected and baseline samples (B), numerous genes with signal intensities of >250 exhibit FCs of >2.0. Genes with positive or negative changes (n-fold) are represented by red and blue dots, respectively.
FIG. 2.
FIG. 2.
Genes upregulated during persistent HCV infection. Genes that were elevated 2.0-fold or greater in at least 5 of the 10 HCV-infected animals are included. The animal identification number is given at the top, the gene name is indicated at the left, and the gene function is given at the right. The first section includes 39 genes that exhibited changes in all 10 animals, with each subsequent section (separated by heavy lines) representing genes with changes in progressively fewer animals. Genes in each section are listed according to the magnitude of the average expression change with the average being calculated from all 10 animals, even when all 10 did not exhibit an FC of >2.0. Several genes are represented on the array more than once with different probe set identifications. SD, standard deviation. An expanded table is available with the accession numbers, complete gene names, gene symbols, probe ID, standard deviations for all genes for all animals, and functional data with regard to the Gene Ontology Biological Process and Molecular Function (see the supplemental material).
FIG. 2.
FIG. 2.
Genes upregulated during persistent HCV infection. Genes that were elevated 2.0-fold or greater in at least 5 of the 10 HCV-infected animals are included. The animal identification number is given at the top, the gene name is indicated at the left, and the gene function is given at the right. The first section includes 39 genes that exhibited changes in all 10 animals, with each subsequent section (separated by heavy lines) representing genes with changes in progressively fewer animals. Genes in each section are listed according to the magnitude of the average expression change with the average being calculated from all 10 animals, even when all 10 did not exhibit an FC of >2.0. Several genes are represented on the array more than once with different probe set identifications. SD, standard deviation. An expanded table is available with the accession numbers, complete gene names, gene symbols, probe ID, standard deviations for all genes for all animals, and functional data with regard to the Gene Ontology Biological Process and Molecular Function (see the supplemental material).
FIG. 3.
FIG. 3.
Genes downregulated during persistent HCV infection. Liver genes that were decreased by −2.0-fold or more in 5 of the 10 animals are included. The first section includes six genes that exhibited changes in all 10 animals, with each subsequent section representing genes with changes in progressively fewer animals. Genes in each section are listed according to the magnitude of the average expression change with the average being calculated from all 10 animals, even when all 10 did not exhibit an FC of >2.0. The animal identification number is given at the top, the gene name is indicated at the left, and the function is given on the right. SD, standard deviation. An expanded table is available with the accession numbers, complete gene names, gene symbols, probe ID, standard deviations for all genes for all animals, and functional data with regard to the Gene Ontology Biological Process and Molecular Function (see the supplemental material).
FIG. 4.
FIG. 4.
Hierarchical clustering of genes with altered expression during HCV infection. A heat map is shown illustrating two-dimensional hierarchical clustering of 971 genes identified as differentially regulated in infected versus noninfected animals by analysis of variance at a 99% confidence level. Animals with HCV infection cluster separately from animals without HCV infection (top cluster diagram). Genes increased or decreased during HCV infection cluster separately (cluster diagram to the left). Increased and decreased expression of specific genes is illustrated by red and green, respectively, while black indicates no change.
FIG. 5.
FIG. 5.
Genes differentially regulated in genotype 3 infection. The nine genotype 1 animals were used as baselines compared to animal 4X0119 of genotype 3. Genes increased or decreased by >2.0-fold in 4X119 compared to expression levels of all genotype 1 animals are listed.
FIG. 6.
FIG. 6.
ISG and cytokine gene expression as a function of viral load. The viral load in the livers of the 10 chronically infected animals in this study was plotted relative to the magnitude of expression changes in ISGs (ISG12 [•] and ISG15 [▿]) and cytokines (I-TAC [♦], IP-10 [▴], and midkine [▪]). The viral RNA level in the liver is given as genome equivalents per microgram of total cell RNA.

References

    1. Alter, H. J., and M. Houghton. 2000. Hepatitis C virus and eliminating post-transfusion hepatitis. Nat. Med. 6:1082-1086. - PubMed
    1. Alter, H. J., and L. B. Seeff. 2000. Recovery, persistence, and sequelae in hepatitis C virus infection: a perspective on long-term outcome. Semin. Liver Dis. 20:17-35. - PubMed
    1. Aractingi, S., N. Briand, C. Le Danff, M. Viguier, H. Bachelez, L. Michel, L. Dubertret, and E. D. Carosella. 2001. HLA-G and NK receptor are expressed in psoriatic skin: a possible pathway for regulating infiltrating T cells? Am. J. Pathol. 159:71-77. - PMC - PubMed
    1. Bainbridge, D., S. Ellis, P. Le Bouteiller, and I. Sargent. 2001. HLA-G remains a mystery. Trends Immunol. 22:548-552. - PubMed
    1. Bassett, S. E., B. Guerra, K. Brasky, E. Miskovsky, M. Houghton, G. R. Klimpel, and R. E. Lanford. 2001. Protective immune response to hepatitis C virus in chimpanzees rechallenged following clearance of primary infection. Hepatology 33:1479-1487. - PubMed

Publication types

LinkOut - more resources