. 2004 Dec;78(24):13848-64.
doi: 10.1128/JVI.78.24.13848-13864.2004.

Overlapping CRE and E box motifs in the enhancer sequences of the bovine leukemia virus 5' long terminal repeat are critical for basal and acetylation-dependent transcriptional activity of the viral promoter: implications for viral latency

Affiliations

Overlapping CRE and E box motifs in the enhancer sequences of the bovine leukemia virus 5' long terminal repeat are critical for basal and acetylation-dependent transcriptional activity of the viral promoter: implications for viral latency

Claire Calomme et al. J Virol. 2004 Dec.

Abstract

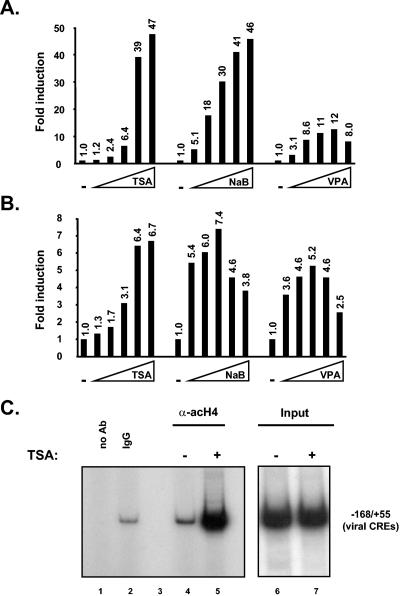
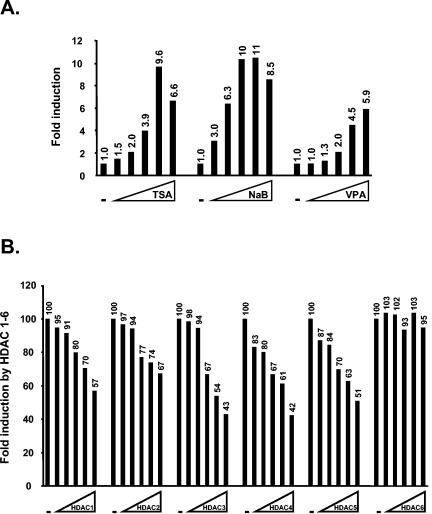
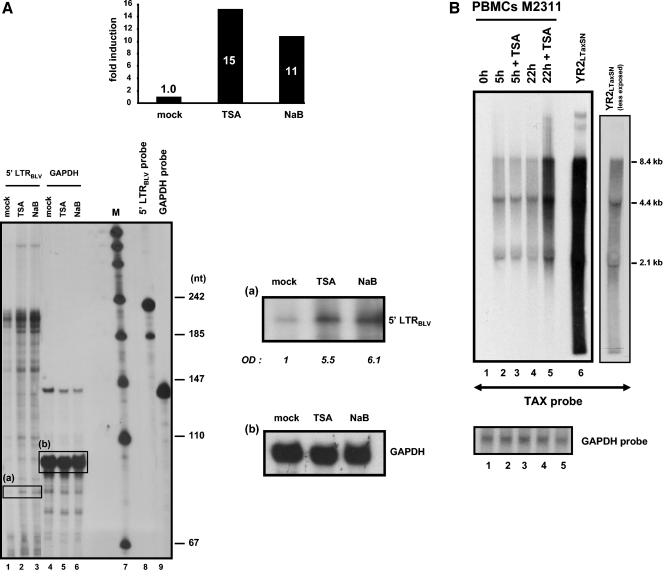
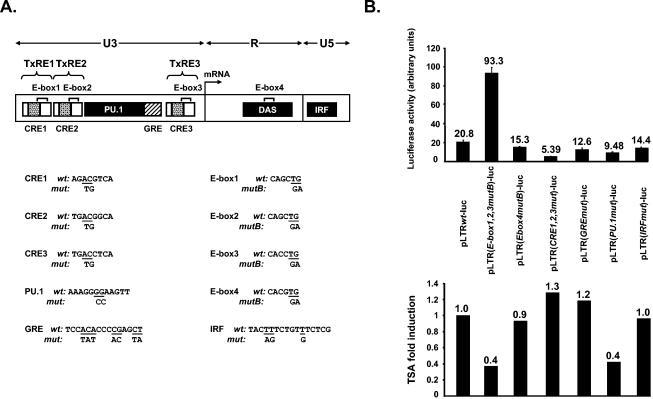
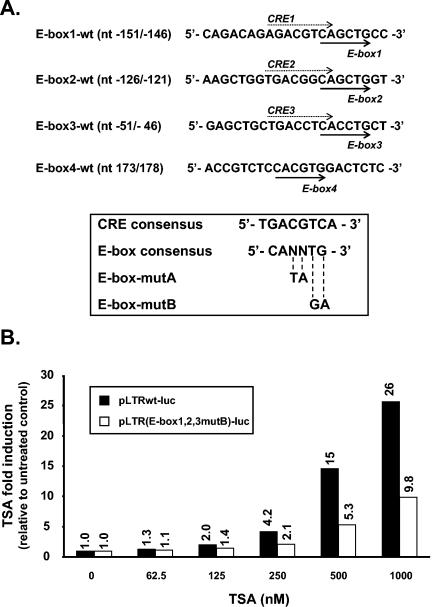
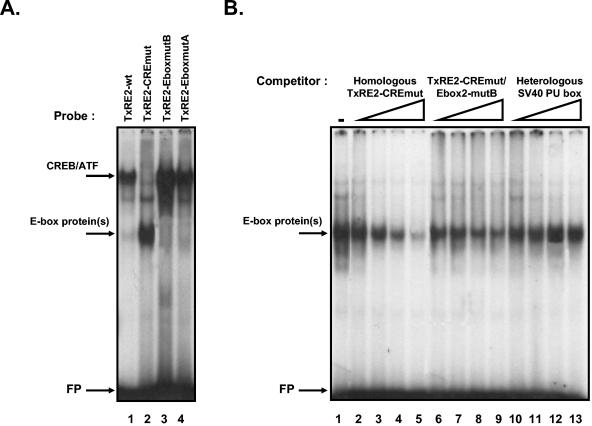
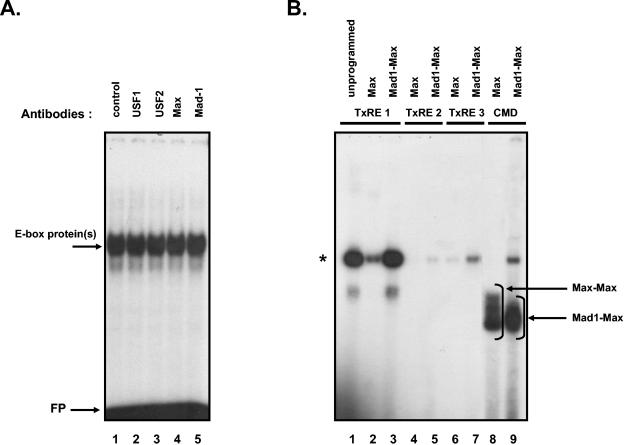
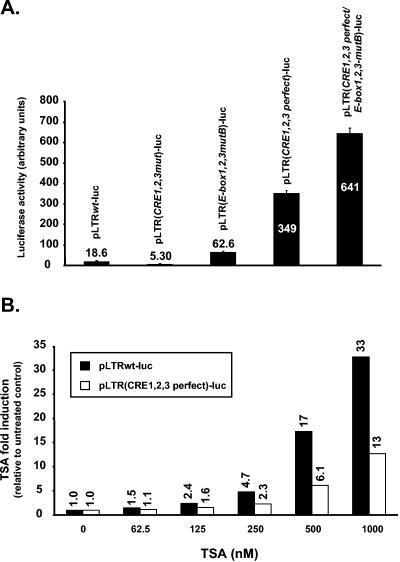
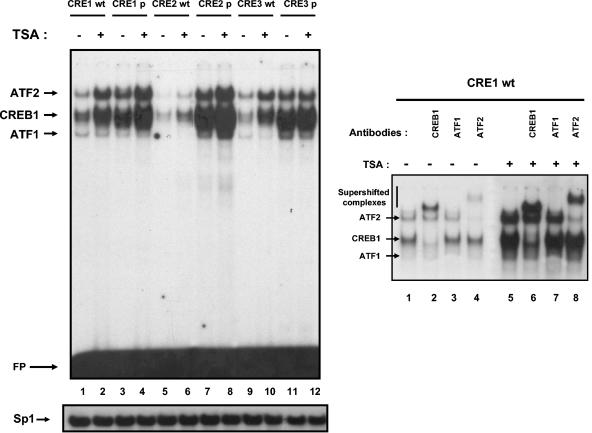
Bovine leukemia virus (BLV) infection is characterized by viral latency in a large proportion of cells containing an integrated provirus. In this study, we postulated that mechanisms directing the recruitment of deacetylases to the BLV 5' long terminal repeat (LTR) could explain the transcriptional repression of viral expression in vivo. Accordingly, we showed that BLV promoter activity was induced by several deacetylase inhibitors (such as trichostatin A [TSA]) in the context of episomal LTR constructs and in the context of an integrated BLV provirus. Moreover, treatment of BLV-infected cells with TSA increased H4 acetylation at the viral promoter, showing a close correlation between the level of histone acetylation and transcriptional activation of the BLV LTR. Among the known cis-regulatory DNA elements located in the 5' LTR, three E box motifs overlapping cyclic AMP responsive elements (CREs) in U3 were shown to be involved in transcriptional repression of BLV basal gene expression. Importantly, the combined mutations of these three E box motifs markedly reduced the inducibility of the BLV promoter by TSA. E boxes are susceptible to recognition by transcriptional repressors such as Max-Mad-mSin3 complexes that repress transcription by recruiting deacetylases. However, our in vitro binding studies failed to reveal the presence of Mad-Max proteins in the BLV LTR E box-specific complexes. Remarkably, TSA increased the occupancy of the CREs by CREB/ATF. Therefore, we postulated that the E box-specific complexes exerted their negative cooperative effect on BLV transcription by steric hindrance with the activators CREB/ATF and/or their transcriptional coactivators possessing acetyltransferase activities. Our results thus suggest that the overlapping CRE and E box elements in the BLV LTR were selected during evolution as a novel strategy for BLV to allow better silencing of viral transcription and to escape from the host immune response.


Figures

FIG. 1.
FIG. 1.
Activation of BLV LTR activity by deacetylase inhibitors. (A) Raji cells were transiently transfected by the DEAE-dextran procedure with 500 ng of pLTRwt-luc. At 20 h posttransfection, cells were mock treated or treated with increasing concentrations of TSA (62.5, 125, 250, 500, and 1,000 nM), NaB (0.61, 1.25, 2.5, 5, and 10 mM), or VPA (0.25, 0.5, 1, 2.5, and 5 μM). Luciferase activities were measured in cell lysates 42 h after transfection and were normalized to protein concentrations. Results are presented as histograms indicating the TSA, NaB, or VPA induction (n-fold) of pLTRwt-luc with respect to its respective basal activity, which was assigned a value of 1. The raw value measured by the Promega luminometer for this basal level was around 25. Values represent the means of duplicate samples. The results from a representative experiment of six independent transfections are shown. (B) Raji cells were transiently transfected by the DEAE-dextran procedure with 500 ng of the episomal pLTR*wt(direct)-luc. At 40 h posttransfection, cells were mock treated or treated with increasing concentrations of TSA, NaB, or VPA (as described above). Luciferase activities were measured in cell lysates 72 h after transfection and were normalized to protein concentrations. Results are presented as histograms indicating the TSA, NaB, or VPA induction (n-fold) of pLTR*wt(direct)-luc with respect to its respective basal activity, which was assigned a value of 1. The raw value measured by the Promega luminometer for this basal level was around 100. Values represent the means of the results from duplicate samples. The results from a representative experiment of three independent transfections are shown. (C) Histone acetylation at the BLV promoter was analyzed by ChIP in YR2 cells. PCR results from mock antibody (no Ab; lane 1), preimmune serum (IgG; lane 2), H2O (lane 3), antibody against acetyl-H4 (lanes 4 and 5), and input (sample representing amplification from a 1:100 dilution of total input chromatin from each ChIP experiment; lanes 6 and 7) are shown. Purified DNA was analyzed by PCR with a primer set amplifying the viral CRE region: 5′-CCGTAAACCAGACAGAGACGTCAG-3′ and 5′-CACGAGGGTCTCAGGAGAAGAAC-3′.
FIG. 2.
FIG. 2.
Response of the BLV promoter to ectopically expressed deacetylases. (A) HeLa cells were transiently transfected by the FuGENE procedure with 500 ng of pLTRwt-luc. At 20 h posttransfection, cells were mock treated or treated with increasing concentrations of TSA (62.5, 125, 250, 500, and 1,000 nM), NaB (0.61, 1.25, 2.5, 5, and 10 mM), or VPA (0.25, 0.5, 1, 2.5, and 5 μM). Luciferase activities were measured in cell lysates 42 h after transfection and were normalized to protein concentrations. Results are presented as histograms indicating the TSA, NaB, or VPA induction (n-fold) of pLTRwt-luc with respect to its respective basal activity, which was assigned a value of 1. The raw value measured by the Promega luminometer for this basal level was around 150. Values represent the means of the results from duplicate samples. The results from a representative experiment of three independent transfections are shown. (B) HeLa cells were transiently cotransfected with 500 ng of pLTRwt-luc and increasing amounts of the HDAC expression vectors (0, 50, 100, 250, 500, and 1,000 ng of plasmid DNA). To maintain the same amount of transfected DNA and to avoid squelching artifacts, the different amounts of cotransfected plasmids were complemented to 1,000 ng of DNA by using the pcDNA3.1 empty plasmid. Luciferase activities were measured in cell lysates 42 h after transfection and were normalized to protein concentrations. Results are presented as histograms indicating the induction by the different HDACs (n-fold) with respect to the activity of the reporter construct in the absence of HDAC1, HDAC2, HDAC3, HDAC4, HDAC5, or HDAC6, which was assigned a value of 1. The raw value measured by the Promega luminometer for this basal level was around 150. Values represent the means of the results from duplicate samples. The results from a representative experiment of three independent transfections are shown.
FIG. 3.
FIG. 3.
Activation of BLV promoter by deacetylase inhibitors occurs at the mRNA level. (A) Upper panel, HeLa cells were transiently transfected with 500 ng of pLTRwt-luc. At 20 h posttransfection, cells were mock treated or treated with TSA (500 nM) or NaB (5 mM). Luciferase activities were measured in cell lysates 42 h after transfection and were normalized to protein concentrations. Results are presented as histograms indicating the TSA or NaB induction of pLTRwt-luc with respect to its respective basal activity, which was assigned a value of 1. Values represent the means of the results from duplicate samples. Lower panel, total RNA samples were prepared from HeLa cells transiently transfected as described above. The RNA samples were incubated with a BLV-specific antisense riboprobe corresponding to the LTR (left panel, lanes 1 to 3) and a specific probe corresponding to the GAPDH gene (left panel, lanes 4 to 6). Names of drugs used are indicated at the top of each lane. Undigested probes are shown for reference (lanes 8 and 9). The figure shows the 83-nucleotide LTRBLV protected band (left panel, a) and one broad band (5 nucleotides wide) corresponding to specific protection of the GAPDH probe (left panel, b). To better visualize these two protected bands, enlargements of lanes 1 to 3 (LTR probe) and 4 to 6 (GAPDH probe) are shown (right panels, a and b, respectively). The quantification of RNA levels was assessed by densitometric scanning of the migrating bands and is presented in optical density (OD) arbitrary units (right panel, a). The results from a representative experiment of three independent RNase protection assays are shown. (B) BLV-infected ovine PBMCs (M2311) were mock treated or treated with TSA (500 nM) for 5 or 22 h. Ten micrograms of total RNA isolated from uncultured PBMCs (lane 1), cultured PBMCs (lanes 2 to 5), or YR2LTaxSN (lane 6) cells was analyzed by Northern blot hybridization with 32P-labeled TAX probe. Sizes of mRNAs are indicated. As a control, the same RNA samples were hybridized with a specific probe corresponding to the GAPDH gene.
FIG. 4.
FIG. 4.
Study of the cis-acting elements involved in the TSA inducibility of the BLV promoter. (A) All the transcription factor binding sites in the 5′ LTR of the BLV genome (exhaustively described in the introduction) and their respective point mutations are represented. The transcription initiation site at the U3-R junction is indicated by an arrow. Wt, wild type; mut, mutant. (B) Raji cells were transiently transfected with 500 ng of either pLTRwt-luc or different reporter constructs mutated in all the binding sites shown in panel A. At 20 h posttransfection, cells were mock treated (upper panel) or treated with TSA (500 nM; lower panel). Luciferase activities were measured in cell lysates 42 h after transfection and were normalized to protein concentrations. Results are presented as histograms indicating either basal luciferase activities (arbitrary units) of wild-type and mutated reporter constructs (upper panel) or TSA inductions (n-fold) of the constructs (lower panel), with the induced activity of pLTRwt-luc arbitrarily set at a value of 1. Values represent the means of the results from triplicate samples. The results from a representative experiment of four independent transfections are shown.
FIG. 5.
FIG. 5.
Differential TSA response of pLTRwt-luc and of pLTR(E-box1,2,3mutB)-luc. (A) Nucleotide sequences of BLV LTR E box motifs and overlapping CRE motifs. For each TxRE, the bases with boldface arrows indicate the E box motif and the bases with dotted arrows indicate the respective CRE motif. The E box and CRE consensus are shown, and for the Ebox-mutA and Ebox-mutB mutated motifs, only the bases that are changed in comparison to the wild-type sequence are indicated. (B) Raji cells were transiently transfected with 500 ng of either pLTRwt-luc or pLTR(E-box1,2,3mutB)-luc. At 20 h posttransfection, cells were mock treated or treated with increasing concentrations of TSA (62.5, 125, 250, 500, and 1,000 nM). Luciferase activities were measured in cell lysates 42 h after transfection and were normalized to protein concentrations. Results are presented as histograms indicating inductions by TSA (n-fold) with respect to the basal activity of each LTR construct, which was assigned a value of 1. The raw value measured by the Promega luminometer for this basal level was around 25. Values represent the means of the results from duplicate samples. The results from a representative experiment of five independent transfections are shown.
FIG. 6.
FIG. 6.
Mutagenesis of the CRE and E box elements located in the TxRE2 motif of the BLV LTR U3 region. (A) The TxRE2-wt (5′-AAGCTGGTGACGGCAGCTGGT-3′), TxRE2-CREmut (5′-AAGCTGGTGTGGGCAGCTGGT-3′), TxRE2-EboxmutB (5′-AAGCTGGTGACGGCAGCGAGT-3′), and TxRE2-EboxmutA (5′-AAGCTGGTGACGGCATATGGT-3′) (mutations are highlighted in boldface type, and motifs are underlined on the coding strand primer) oligonucleotides were 5′ end labeled and used as probes. These probes were incubated with 5 μg of nuclear extracts from BLV-infected ovine PBMCs (M2658). The CREB/ATF complex as well as the faster-migrating E box complex are indicated by arrows. The free probe (FP) is also indicated. (B) The TxRE2-CREmut oligonucleotide was 5′ end labeled and used as a probe. This probe was incubated with 5 μg of nuclear extracts from BLV-infected ovine PBMCs (M2658) either in the absence (−) of competitor (lane 1) or in the presence of increasing concentrations (5-, 25-, 50-, and 100-fold molar excesses) of the homologous TxRE2-CREmut oligonucleotide (lanes 2 to 5), of the TxRE2-CREmut/EboxmutB (5′-AAGCTGGTGTGGGCAGCGAGT-3′) (Fig. 5A) oligonucleotide (lanes 6 to 9) or of the heterologous SV40 PU-box (5′-TGAAATAACCTCTGAAAGAGGAACTTGGTTAGGTA-3′) oligonucleotide (lanes 10 to 13). The E box-specific complex is indicated by an arrow. The free probe (FP) is also indicated.
FIG. 7.
FIG. 7.
Characterization of the factors binding to the E box element located in the TxRE2 motif of the BLV LTR. (A) The TxRE2-CREmut oligonucleotide probe was incubated with 5 μg of nuclear extracts from BLV-infected ovine PBMCs (M2658). Next, antibodies directed against different members of the bHLH family of transcriptional regulatory proteins (lanes 2 to 5) or purified rabbit IgG (as a negative control) (lane 1) were added to the binding reaction mixture. The polyclonal antibodies used are indicated at the top of each lane. The major DNA-protein complex and free probe (FP) are indicated by arrows. (B) The TxRE1-wt (5′-CAGACAGAGACGTCAGCTGCC-3′), TxRE2-wt, TxRE3-wt (5′-GAGCTGCTGACCTCACCTGCT-3′), and CMD (specific E box) oligonucleotides were 5′ end labeled and used as probes. These probes were incubated with either in vitro-translated Max (lanes 2, 4, 6, and 8), in vitro-translated Mad1-Max complexes (lanes 3, 5, 7, and 9), or unprogrammed reticulocyte lysate (lane 1) as a negative control. The Max-Max and Mad1-Max complexes are indicated by arrows. A TxRE- and CMD-binding protein constitutively present in the reticulocyte lysate is indicated by an asterisk. The free probe was run out of the gel for better separation of the complexes.
FIG. 8.
FIG. 8.
Effects of perfect consensus CREs on basal and TSA-induced BLV promoter activity. (A) Raji cells were transiently transfected with 500 ng of either pLTRwt-luc, pLTR(CRE1,2,3mut)-luc, pLTR(E-box1,2,3mutB)-luc, pLTR(CRE 1,2,3 perfect)-luc, or pLTR(CRE1,2,3-perfect/E-box1,2,3-mutB)-luc. Luciferase activities were measured in cell lysates 42 h after transfection. The results are presented as histograms indicating luciferase activities (arbitrary units) normalized to protein concentrations. Values represent the means of the results from triplicate samples. A representative experiment of three independent transfections is shown. (B) Raji cells were transiently transfected with 500 ng of either pLTRwt-luc or pLTR(CRE1,2,3 perfect)-luc. At 20 h posttransfection, cells were mock treated or treated with increasing concentrations of TSA (62.5, 125, 250, 500, and 1,000 nM). Luciferase activities were measured in cell lysates 42 h after transfection and were normalized to protein concentrations. Results are presented as histograms indicating inductions by TSA (n-fold) with respect to the basal activity of each LTR construct, which was assigned a value of 1. The raw value measured by the Promega luminometer for this basal level was around 25. Values represent the means of the results from duplicate samples. The results from a representative experiment of three independent transfections are shown.
FIG. 9.
FIG. 9.
TSA treatment increases CREB/ATF binding activity. Nuclear extracts were prepared from BLV-infected ovine PBMCs (M2658) mock treated or treated with TSA (500 nM) for 22 h. The TxRE1-wt, TxRE2-wt, and TxRE3-wt oligonucleotides (referred to as CRE1wt, CRE2wt, and CRE3wt) as well as the respective oligonucleotides harboring a perfect CRE (CRE1p, 5′-CAGACAGTGACGTCAGCTGCC-3′; CRE2p, 5′-AAGCTGGTGACGTCAGCTGGT-3′; CRE3p, 5′-GAGCTGCTGACGTCACCTGCT-3′) were used as probes and incubated with 5 μg of nuclear extracts (left panel, lanes 1 to 12). In addition, supershift assays were performed with the TxRE1-wt oligonucleotide as a probe. Antibodies directed against CREB1, ATF1, or ATF2 were added to the binding reaction (right panel, lanes 2 to 4, 6 to 8). The major DNA-protein complexes are indicated by arrows. The supershifted complexes are also indicated. As a control for equal loading, the lower panel shows the comparability of the various nuclear extracts assessed by EMSA with an Sp1 consensus probe (5′-ATTCGATCGGGGCGGGGCGAGC-3′). The free probe (FP) is also indicated.

Similar articles

Cited by

References

    1. Adam, E., P. Kerkhofs, M. Mammerickx, A. Burny, R. Kettman, and L. Willems. 1996. The CREB, ATF-1, and ATF-2 transcription factors from bovine leukemia virus-infected B lymphocytes activate viral expression. J. Virol. 70:1990-1999. - PMC - PubMed
    1. Adam, E., P. Kerkhofs, M. Mammerickx, R. Kettmann, A. Burny, L. Droogmans, and L. Willems. 1994. Involvement of the cyclic AMP-responsive element binding protein in bovine leukemia virus expression in vivo. J. Virol. 68:5845-5853. - PMC - PubMed
    1. Ahringer, J. 2000. NuRD and SIN3 histone deacetylase complexes in development. Trends Genet. 16:351-356. - PubMed
    1. Arias, J., A. S. Alberts, P. Brindle, F. X. Claret, T. Smeal, M. Karin, J. Feramisco, and M. Montminy. 1994. Activation of cAMP and mitogen responsive genes relies on a common nuclear factor. Nature 370:226-229. - PubMed
    1. Ayer, D. E., C. D. Laherty, Q. A. Lawrence, A. P. Armstrong, and R. N. Eisenman. 1996. Mad proteins contain a dominant transcription repression domain. Mol. Cell. Biol. 16:5772-5781. - PMC - PubMed

Publication types

MeSH terms

Substances