Comparison of human immunodeficiency virus (HIV)-specific T-cell responses in HIV-1- and HIV-2-infected individuals in Senegal
- PMID: 15564501
- PMCID: PMC533895
- DOI: 10.1128/JVI.78.24.13934-13942.2004
Comparison of human immunodeficiency virus (HIV)-specific T-cell responses in HIV-1- and HIV-2-infected individuals in Senegal
Abstract
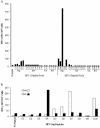
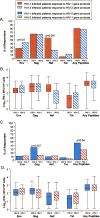
Human immunodeficiency virus type 2 (HIV-2) infection is typically less virulent than HIV-1 infection, which may permit the host to mount more effective, sustained T-cell immunity. We investigated antiviral gamma interferon-secreting T-cell responses by an ex vivo Elispot assay in 68 HIV-1- and 55 HIV-2-infected Senegalese patients to determine if differences relate to more efficient HIV-2 control. Homologous HIV-specific T cells were detected in similar frequencies (79% versus 76%, P = 0.7) and magnitude (3.12 versus 3.08 log(10) spot-forming cells/10(6) peripheral blood mononuclear cells) in HIV-1 and HIV-2 infection, respectively. Gag-specific responses predominated in both groups (>/=64%), and significantly higher Nef-specific responses occurred in HIV-1-infected (54%) than HIV-2-infected patients (22%) (P < 0.001). Heterologous responses were more frequent in HIV-1 than in HIV-2 infection (46% versus 27%, P = 0.04), but the mean magnitude was similar. Total frequencies of HIV-specific responses in both groups did not correlate with plasma viral load and CD4(+) T-cell count in multivariate regression analyses. However, the magnitude of HIV-2 Gag-specific responses was significantly associated with lower plasma viremia in HIV-1-infected patients (P = 0.04). CD4(+) T-helper responses, primarily recognizing HIV-2 Gag, were detected in 48% of HIV-2-infected compared to only 8% of HIV-1-infected patients. These findings indicate that improved control of HIV-2 infection may relate to the contribution of T-helper cell responses. By contrast, the superior control of HIV-1 replication associated with HIV-2 Gag responses suggests that these may represent cross-reactive, higher-avidity T cells targeting epitopes within Gag regions of functional importance in HIV replication.
Figures


Similar articles
-
Higher homologous and lower cross-reactive Gag-specific T-cell responses in human immunodeficiency virus type 2 (HIV-2) than in HIV-1 infection.J Virol. 2008 Sep;82(17):8619-28. doi: 10.1128/JVI.00027-08. Epub 2008 Jun 18. J Virol. 2008. PMID: 18562522 Free PMC article.
-
Role of human immunodeficiency virus (HIV)-specific T-cell immunity in control of dual HIV-1 and HIV-2 infection.J Virol. 2007 Sep;81(17):9061-71. doi: 10.1128/JVI.00117-07. Epub 2007 Jun 20. J Virol. 2007. PMID: 17582003 Free PMC article.
-
Cytolytic T lymphocytes (CTLs) from HIV-1 subtype C-infected Indian patients recognize CTL epitopes from a conserved immunodominant region of HIV-1 Gag and Nef.J Infect Dis. 2005 Sep 1;192(5):749-59. doi: 10.1086/432547. Epub 2005 Jul 27. J Infect Dis. 2005. PMID: 16088824
-
HIV-2 and T cell recognition.Curr Opin Immunol. 1998 Aug;10(4):382-7. doi: 10.1016/s0952-7915(98)80108-8. Curr Opin Immunol. 1998. PMID: 9722912 Review.
-
How human immunodeficiency virus ravages the immune system.Curr Opin Immunol. 1992 Aug;4(4):463-5. doi: 10.1016/s0952-7915(06)80040-3. Curr Opin Immunol. 1992. PMID: 1356347 Review.
Cited by
-
Higher homologous and lower cross-reactive Gag-specific T-cell responses in human immunodeficiency virus type 2 (HIV-2) than in HIV-1 infection.J Virol. 2008 Sep;82(17):8619-28. doi: 10.1128/JVI.00027-08. Epub 2008 Jun 18. J Virol. 2008. PMID: 18562522 Free PMC article.
-
Natural killer cell function is well preserved in asymptomatic human immunodeficiency virus type 2 (HIV-2) infection but similar to that of HIV-1 infection when CD4 T-cell counts fall.J Virol. 2006 Mar;80(5):2529-38. doi: 10.1128/JVI.80.5.2529-2538.2006. J Virol. 2006. PMID: 16474159 Free PMC article.
-
Major depletion of plasmacytoid dendritic cells in HIV-2 infection, an attenuated form of HIV disease.PLoS Pathog. 2009 Nov;5(11):e1000667. doi: 10.1371/journal.ppat.1000667. Epub 2009 Nov 20. PLoS Pathog. 2009. PMID: 19936055 Free PMC article.
-
Association between peripheral γδ T-cell profile and disease progression in individuals infected with HIV-1 or HIV-2 in West Africa.J Acquir Immune Defic Syndr. 2011 Jun 1;57(2):92-100. doi: 10.1097/QAI.0b013e318215a877. J Acquir Immune Defic Syndr. 2011. PMID: 21423026 Free PMC article.
-
Polyfunctional T cell responses are a hallmark of HIV-2 infection.Eur J Immunol. 2008 Feb;38(2):350-63. doi: 10.1002/eji.200737768. Eur J Immunol. 2008. PMID: 18200635 Free PMC article.
References
-
- Addo, M. M., X. G. Yu, A. Rathod, D. Cohen, R. L. Eldridge, D. Strick, M. N. Johnston, C. Corcoran, A. G. Wurcel, C. A. Fitzpatrick, M. E. Feeney, W. R. Rodriguez, N. Basgoz, R. Draenert, D. R. Stone, C. Brander, P. J. Goulder, E. S. Rosenberg, M. Altfeld, and B. D. Walker. 2003. Comprehensive epitope analysis of human immunodeficiency virus type 1 (HIV-1)-specific T-cell responses directed against the entire expressed HIV-1 genome demonstrate broadly directed responses, but no correlation to viral load. J. Virol. 77:2081-2092. - PMC - PubMed
-
- Ariyoshi, K., F. Cham, N. Berry, S. Jaffar, S. Sabally, T. Corrah, and H. Whittle. 1995. HIV-2-specific cytotoxic T-lymphocyte activity is inversely related to proviral load. AIDS 9:555-559. - PubMed
-
- Bertoletti, A., F. Cham, S. McAdam, T. Rostron, S. Rowland-Jones, S. Sabally, T. Corrah, K. Ariyoshi, and H. Whittle. 1998. Cytotoxic T cells from human immunodeficiency virus type 2-infected patients frequently cross-react with different human immunodeficiency virus type 1 clades. J. Virol. 72:2439-2448. - PMC - PubMed
-
- Betts, M. R., D. R. Ambrozak, D. C. Douek, S. Bonhoeffer, J. M. Brenchley, J. P. Casazza, R. A. Koup, and L. J. Picker. 2001. Analysis of total human immunodeficiency virus (HIV)-specific CD4+ and CD8+ T-cell responses: relationship to viral load in untreated HIV infection. J. Virol. 75:11983-11991. - PMC - PubMed
Publication types
MeSH terms
Substances
Grants and funding
LinkOut - more resources
Full Text Sources
Medical
Research Materials

