. 2004 Nov 24;24(47):10616-27.
doi: 10.1523/JNEUROSCI.2469-04.2004.

Peroxynitrite-induced neuronal apoptosis is mediated by intracellular zinc release and 12-lipoxygenase activation

Affiliations

Peroxynitrite-induced neuronal apoptosis is mediated by intracellular zinc release and 12-lipoxygenase activation

Yumin Zhang et al. J Neurosci. .

Abstract

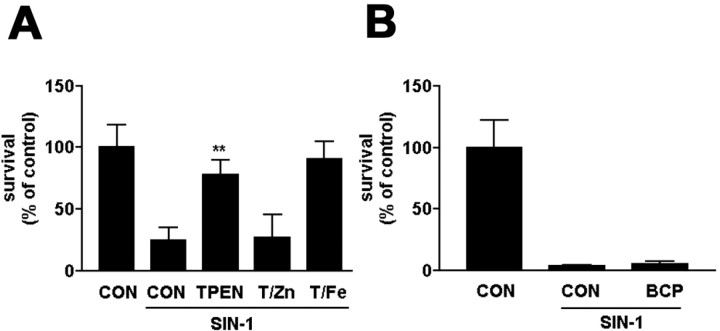
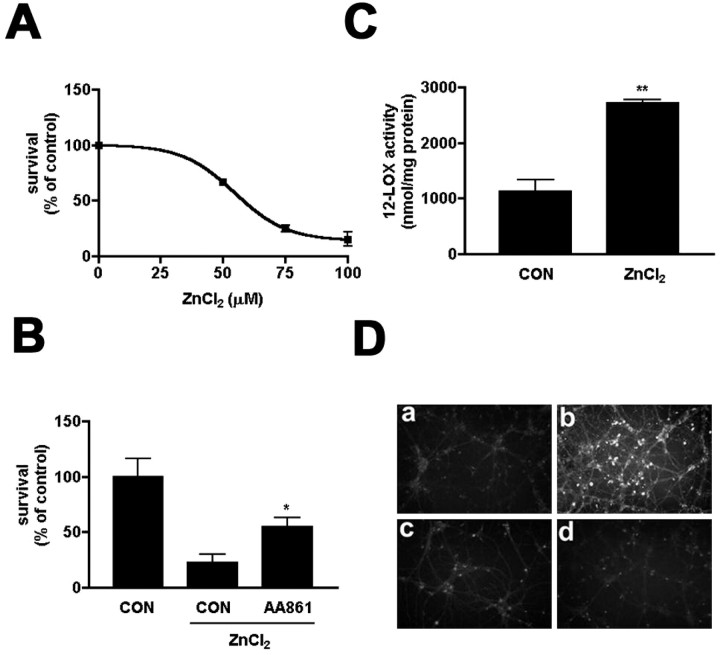
Peroxynitrite toxicity is a major cause of neuronal injury in stroke and neurodegenerative disorders. The mechanisms underlying the neurotoxicity induced by peroxynitrite are still unclear. In this study, we observed that TPEN [N,N,N',N'-tetrakis (2-pyridylmethyl)ethylenediamine], a zinc chelator, protected against neurotoxicity induced by exogenous as well as endogenous (coadministration of NMDA and a nitric oxide donor, diethylenetriamine NONOate) peroxynitrite. Two different approaches to detecting intracellular zinc release demonstrated the liberation of zinc from intracellular stores by peroxynitrite. In addition, we found that peroxynitrite toxicity was blocked by inhibitors of 12-lipoxygenase (12-LOX), p38 mitogen-activated protein kinase (MAPK), and caspase-3 and was associated with mitochondrial membrane depolarization. Inhibition of 12-LOX blocked the activation of p38 MAPK and caspase-3. Zinc itself induced the activation of 12-LOX, generation of reactive oxygen species (ROS), and activation of p38 MAPK and caspase-3. These data suggest a cell death pathway triggered by peroxynitrite in which intracellular zinc release leads to activation of 12-LOX, ROS accumulation, p38 activation, and caspase-3 activation. Therefore, therapies aimed at maintaining intracellular zinc homeostasis or blocking activation of 12-LOX may provide a novel avenue for the treatment of inflammation, stroke, and neurodegenerative diseases in which the formation of peroxynitrite is thought to be one of the important causes of cell death.


Figures

Figure 1.
Figure 1.
TPEN is protective against neurotoxicity induced by peroxynitrite. A, TPEN protected against SIN-1-induced neurotoxicity. Neurons were exposed to SIN-1 (1 mm) with and without TPEN (1 μm) for 24 hr, and then the neurotoxicity was examined. **p < 0.01 was obtained when the TPEN-treated group was compared with the group treated with SIN-1 alone. a, Control; b, SIN-1; c, TPEN; d, TPEN/SIN-1. One representative experiment of five performed is shown. B, TPEN protected against neurotoxicity induced by authentic peroxynitrite. Neurons were exposed to authentic peroxynitrite (100 μm) in the absence or presence of various concentrations of TPEN (1, 3, 10 μm) for 24 hr, and then the neurotoxicity was examined. **p < 0.01 and ***p < 0.001 were obtained when the TPEN-treated groups were compared with the group treated with peroxynitrite alone. One representative experiment of three performed is shown. C, Nitric oxide has a synergistic effect with NMDA in producing neurotoxicity. Neurons were exposed to NMDA (N) (20 μm), DETA/NO (D) (300 μm), or NMDA plus DETA/NO (N+D) for 24 hr, and then the neurotoxicity was examined. ***p < 0.001 was obtained when the NMDA plus DETA/NO-treated group was compared with other groups. One representative experiment of six performed is shown. D, Free-radical spin traps blocked neurotoxicity induced by NMDA plus DETA/NO. Neurons were exposed to NMDA (20 μm) plus DETA/NO (300 μm) in the absence or presence of free-radical spin traps (10 mm PBN or 1 mm TEMPO) or MnTBAP (100 μm) for 4 hr, and then the neurotoxicity was examined. ***p < 0.001 was obtained when the drug-treated groups were compared with the group treated with NMDA plus the DETA/NO-treated group alone. One representative experiment of four performed is shown. E, TPEN protected against neurotoxicity induced by NMDA plus DETA/NO. Neurons were exposed to NMDA (20 μm) plus DETA/NO (300 μm) for 1 hr; the toxicity was examined at 24 hr. *p < 0.05 was obtained when the TPEN-treated group was compared with the group treated with NMDA plus DETA/NO alone. One representative experiment of three performed is shown. CON, Control. Error bars represent SD.
Figure 2.
Figure 2.
Peroxynitrite-induced neurotoxicity is mediated by zinc but not by iron or copper. A, TPEN (1 μm) protection against SIN-1-induced neurotoxicity was eliminated by coadministration of an equimolar concentration of ZnCl2 (T/Zn) (1 μm) but not of FeCl2 (T/Fe) (1 μm). **p < 0.01 was obtained when the TPEN-treated group was compared with the group treated with SIN-1 alone. One representative experiment of three performed is shown. B, Copper chelator had no effect on SIN-1-induced neurotoxicity. BCP (100 μm) represents bathocuproine. One representative experiment of three performed is shown. CON, Control. Error bars represent SD.
Figure 3.
Figure 3.
Peroxynitrite induced intracellular free zinc accumulation. A, B, Interaction of peroxynitrite with the fluorescent zinc indicators Newport Green and FluoZin-3. A, Peroxynitrite (ONOO) induced an increase in Newport Green fluorescence in EBSS. ***p < 0.001 when compared with the control (CON). B, Peroxynitrite did not interact with FluoZin-3. The fluorescence intensity of FluoZin-3 was similar in EBSS with or without peroxynitrite. C, TPEN blocked the increase in FluoZin-3 fluorescence in neurons induced by peroxynitrite. Neurons were preloaded with FluoZin-3 for 30 min, washed, and then treated with peroxynitrite in the absence or presence of TPEN. a, Control; b, peroxynitrite (100 μm); c, peroxynitrite with TPEN (10 μm). D-F, FRET demonstrated the binding or liberation of Zn2+ from MT in neurons. Cortical neurons were transfected with an MT-FRET construct flanked by ECFP and EYFP. Twenty-four hours after transfection, cells (n = 52) were monitored for changes in the 535/480 emission intensity ratio before, during, and after exposure to 10 μm Zn2+ plus 20 μm pyrithione (a zinc ionophore) (D), 3 μm Zn2+ plus 20 μm pyrithione followed by 300 μm DTDP (E), or 140 μm peroxynitrite (F). An increase in the 535/480 ratio reflects the binding of Zn2+ to protein not saturated by the metal, whereas a decrease in the ratio indicates the liberation of Zn2+ from MT-FRET. Inset in D shows the raw, individual emission measurements used to obtain the ratio for the cell shown in that figure. Inset in F denotes the 535/480 ratio (mean ± SEM; n = 7) immediately before (control) and 5 min after the peroxynitrite treatment (*p < 0.001; two-tailed paired t test). Error bars represent SD.
Figure 4.
Figure 4.
Effect of pyruvate on SIN-1-induced ATP depletion and neurotoxicity. A, Pyruvate did not prevent neurotoxicity induced by 24 hr of SIN-1 exposure. Neurons were exposed to SIN-1 (1 mm) in the absence or presence of pyruvate (10 mm) for 24 hr, and then the toxicity was examined. PYR/S, Pyruvate plus SIN-1. One representative experiment of three performed is shown. B, Pyruvate (PYR; 10 mm) protected against neurotoxicity at 24 hr after 1-3 hr of SIN-1 exposure. **p < 0.01 and ***p < 0.001 were obtained when pyruvate-treated groups were compared with the corresponding groups treated with SIN-1 alone. One representative experiment of three performed is shown. C, Pyruvate (10 mm) blocked ATP depletion induced by 1-2 hr of SIN-1 (1 mm) exposure but not by 3 hr of SIN-1 exposure. The cellular levels of ATP were examined in neurons treated with SIN-1 or SIN-1 together with pyruvate at 1, 2, and 3 hr. ***p < 0.001 was obtained when pyruvate-treated groups were compared with the corresponding groups treated with SIN-1 alone. One representative experiment of three performed is shown. D, TPEN did not block ATP depletion induced by SIN-1. Neurons were exposed to SIN-1 with or without TPEN for 1 hr, and then the cellular levels of ATP were examined. One representative experiment of three performed is shown. CON, Control; TPEN/S, TPEN plus SIN-1. Error bars represent SD.
Figure 5.
Figure 5.
TPEN had no effect on GSH depletion induced by SIN-1. Neurons were exposed to SIN-1 (1 mm) in the absence or presence of TPEN (10 μm) for 30 min, and then the neurons were lysed and assayed for GSH activity. One representative experiment of four performed is shown. ***p < 0.001 was obtained when the SIN-1 group was compared with the control group. CON, Control. Error bars represent SD.
Figure 6.
Figure 6.
SIN-1-induced neurotoxicity was mediated by 12-LOX activation. A, 12-LOX inhibitors blocked neurotoxicity induced by SIN-1. Neurons were exposed to SIN-1 (1 mm) for 1 hr, and the toxicity was examined at 24 hr. For AA861 (10 μm)- and BMD-122 (1 μm)-treated groups, the drugs were applied before, during, and after SIN-1 treatment. **p < 0.01 was obtained when drug-treated groups were compared with the group treated with SIN-1 alone. One representative experiment of five performed is shown. B, TPEN blocked 12-LOX activation induced by SIN-1. Neurons were exposed to SIN-1 (1 mm) in the absence or presence of TPEN (10 μm) for 60 min, and then the 12-LOX activity was examined. ***p < 0.001 was obtained when the SIN-1-treated group was compared with the control group. ##p < 0.01 was obtained when the TPEN-treated group was compared with the SIN-1 alone group. One representative experiment of four performed is shown. CON, Control. Error bars represent SD.
Figure 7.
Figure 7.
12-LOX activation is involved in neurotoxicity induced by exogenous zinc. A, Concentration dependence of zinc toxicity to neurons. Neurons were exposed to a various concentration of ZnCl2 (50, 75, and 100 μm) for 90 min, and the neurotoxicity was examined at 24 hr. One representative experiment of five performed is shown. B, 12-LOX inhibitor blocked neurotoxicity induced by zinc. Neurons were exposed to ZnCl2 (75 μm) for 90 min, and the toxicity was examined at 24 hr. For the drug-treated group, AA861 (10 μm) was applied before, during, and after zinc treatment. *p < 0.05 was obtained when the drug-treated group was compared with the group treated with zinc alone. One representative experiment of three performed is shown. C, Zinc induced 12-LOX activation. Neurons were exposed to ZnCl2 (75 μm) for 1 hr, and then the 12-LOX activity was examined. **p < 0.01 was obtained when the zinc-treated group was compared with the control group. One representative experiment of three performed is shown. D, Inhibition of 12-LOX blocked ROS generation induced by zinc. At 2 hr after zinc exposure (75 μm for 90 min), neurons were loaded with DHR-123 for 20 min, and the image was examined under a fluorescent microscope. a, Control; b, ZnCl2; c, AA861/ZnCl2; d, vitamin E/ZnCl2. One representative experiment of three performed is shown. CON, Control. Error bars represent SD.
Figure 8.
Figure 8.
The zinc chelator and a 12-LOX inhibitor attenuated the mitochondrial membrane depolarization induced by peroxynitrite. TPEN (10 μm) and BMD-122 (1 μm) attenuated mitochondrial membrane depolarization induced by SIN-1. A, At 5 hr after SIN-1 exposure (1 mm for 90 min), neurons were loaded with JC-1 for 20 min, and the image was examined under a fluorescent microscope. a, Control; b, SIN-1; c, TPEN/SIN-1; d, BMD-122/SIN-1. The percentage decrease of JC-1 ratio reflecting the loss of mitochondrial membrane potential is shown in B. *p < 0.05 and ***p < 0.001 were obtained when BMD-122- or TPEN-treated neurons were compared with neurons treated with SIN-1 alone. One representative experiment of three performed is shown. Error bars represent SD. TPEN/S, TPEN/SIN-1; BMD/S, BMD-122/SIN-1.
Figure 9.
Figure 9.
Peroxynitrite or zinc induced caspase-3 activation. A, Caspase inhibitors did not block neurotoxicity induced by 24 hr of SIN-1 exposure. Neurons were exposed to SIN-1 for 24 hr, and then toxicity was examined. Ac-DEVD-CMK and zVAD-FMK were administered before and during SIN-1 exposure. B, Caspase inhibitors blocked neurotoxicity induced by short exposure of SIN-1. Neurons were exposed to SIN-1 for 90 min, and toxicity was examined at 24 hr. Ac-DEVD-CMK and zVAD-FMK were administered before, during, and after SIN-1 exposure. *p < 0.05 and ***p < 0.001 were obtained when drug-treated groups were compared with the group treated with SIN-1 alone. One representative experiment of four performed is shown. C, Caspase inhibitors blocked neurotoxicity induced by zinc. Neurons were exposed to ZnCl2 for 90 min, and toxicity was examined at 24 hr. Ac-DEVD-CMK and zVAD-FMK were administered before, during, and after ZnCl2 exposure. **p < 0.01 and ***p < 0.001 were obtained when drug-treated groups were compared with the group treated with ZnCl2 alone. One representative experiment of four performed is shown. D, SIN-1 or ZnCl2 induced caspase-3 activation. At 7 hr after SIN-1 exposure (1 mm for 90 min), neurons were loaded with FITC-DEVD-FMK for 1 hr, and then the image was examined under fluorescent microcopy. a, Control; b, SIN-1; c, ZnCl2; d, staurosporine. One representative experiment of three performed is shown. CON, Control. Error bars represent SD.
Figure 10.
Figure 10.
Peroxynitrite induced phosphorylation of p38 MAPK. A, Inhibition of p38, but not ERK42/44, blocked neurotoxicity induced by SIN-1. Neurons were exposed to SIN-1 for 1 hr, and toxicity was examined at 24 hr. SB203580 (SB) (10 μm) and U0126 (5 μm) were administered before, during, and after SIN-1 exposure. *p < 0.05 was obtained when the SB-treated group was compared with the SIN-1 group. One representative experiment of four performed is shown. B, SIN-1 induced phosphorylation of p38. Neurons were exposed to SIN-1 in the absence or presence of TPEN, AA861, and Ac-DEVD-CMK for 1 hr, and the phosphorylation of p38 was examined by immunoblot. SIN-1 (1 mm) induced significant phosphorylation of p38 (P-p38). TPEN (10 μm) and AA861 (10 μm) blocked the phosphorylation, but Ac-DEVD-CMK (DEVD) (100 μm) had no effect. One representative experiment of three performed is shown. C, Inhibition of zinc release, 12-LOX activation, and p38 phosphorylation blocked SIN-1-induced caspase activation. At 7 hr after SIN-1 exposure (1 mm for 90 min), neurons were lysed. After centrifugation, the caspase-3 activity in the supernatant was examined. ***p < 0.001 was obtained when the SIN-1-treated group was compared with the control or the drug-treated groups. One representative experiment of three performed is shown. CON, Control. Error bars represent SD.

Similar articles

Cited by

References

    1. Aizenman E, Stout AK, Hartnett KA, Dineley KE, McLaughlin B, Reynolds IJ (2000) Induction of neuronal apoptosis by thiol oxidation: putative role of intracellular zinc release. J Neurochem 75: 1878-1888. - PubMed
    1. Ara J, Przedborski S, Naini AB, Jackson-Lewis V, Trifiletti RR, Horwitz J, Ischiropoulos H (1998) Inactivation of tyrosine hydroxylase by nitration following exposure to peroxynitrite and 1-methyl-4-phenyl-1,2,3,6-tetrahydropyridine (MPTP). Proc Natl Acad Sci USA 95: 7659-7663. - PMC - PubMed
    1. Arai K, Nishiyama N, Matsuki N, Ikegaya Y (2001) Neuroprotective effects of lipoxygenase inhibitors against ischemic injury in rat hippocampal slice cultures. Brain Res 904: 167-172. - PubMed
    1. Aravindakumar CT, Ceulemans J, De Ley M (1999) Nitric oxide induces Zn2+ release from metallothionein by destroying zinc-sulphur clusters without concomitant formation of S-nitrosothiol. Biochem J 344: 253-258. - PMC - PubMed
    1. Armstrong C, Leong W, Lees GJ (2001) Comparative effects of metal chelating agents on the neuronal cytotoxicity induced by copper (Cu+2), iron (Fe+3) and zinc in the hippocampus. Brain Res 892: 51-62. - PubMed

Publication types

MeSH terms