

Personality predicts brain responses to cognitive demands
- PMID: 15564579
- PMCID: PMC6730115
- DOI: 10.1523/JNEUROSCI.3206-04.2004
Personality predicts brain responses to cognitive demands
Abstract
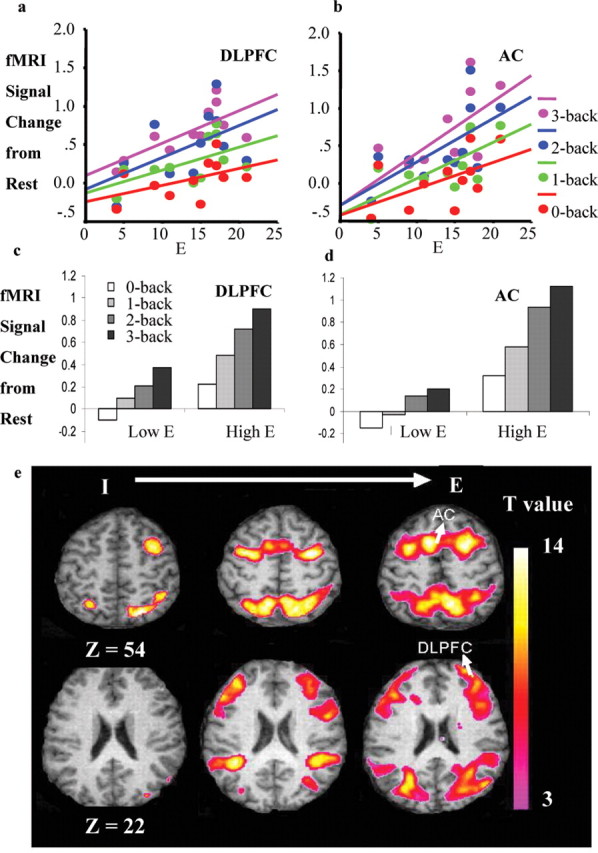
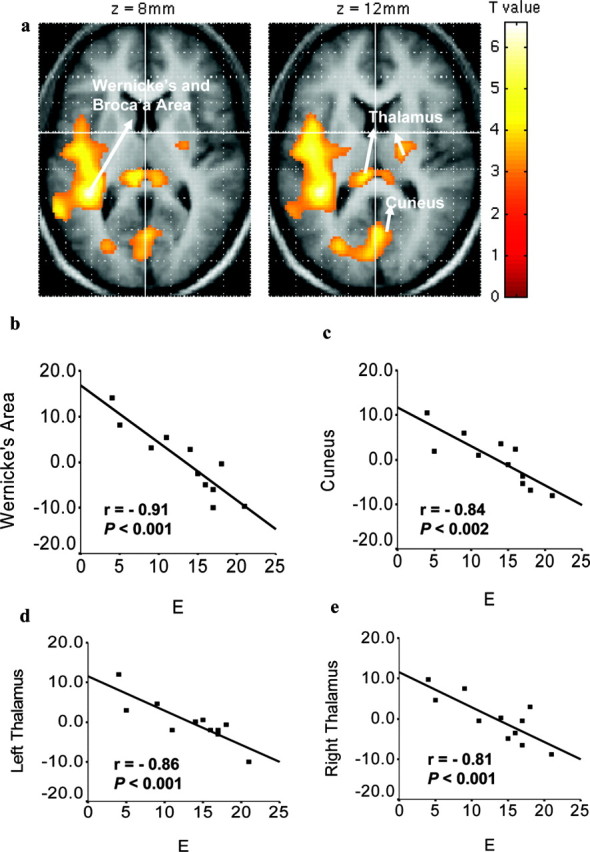
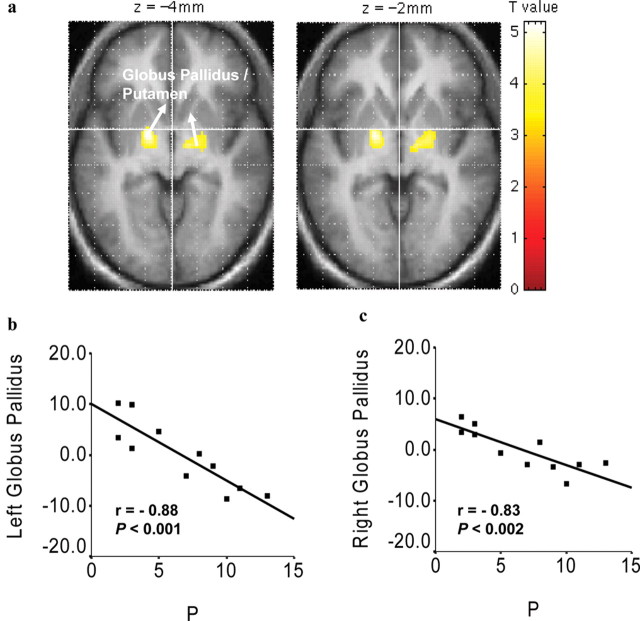
Eysenck (1981) proposed that the personality dimension of introversion- extraversion (E) reflects individual differences in a cortical arousal system modulated by reticulothalamic- cortical pathways: it is chronically more active in introverts relative to extraverts and influences cognitive performance in interaction with task parameters. A circuit with connections to this system, including the dorsolateral prefrontal cortex (DLPFC) and anterior cingulate (AC) cortex, has been identified in studies applying functional magnetic resonance imaging (fMRI) to a broad range of cognitive tasks. We examined the influence of E, assessed with the Eysenck Personality Questionnaire-Revised (Eysenck and Eysenck, 1991), in fMRI activity during an "n-back" task involving four memory loads (0-, 1-, 2-, and 3-back) and a rest condition in healthy men. To confirm the specificity of E effects, we also examined the effects of neuroticism and psychoticism (P) scores. We observed that, as predicted by Eysenck's model, the higher the E score, the greater the change in fMRI signal from rest to the 3-back condition in the DLPFC and AC. In addition, E scores were negatively associated with resting fMRI signals in the thalamus and Broca's area extending to Wernicke's area, supporting the hypothesized (negative) relationship between E and resting arousal. P scores negatively correlated with resting fMRI signal in the globus pallidus-putamen, extending previous findings of a negative relationship of schizotypy to striatal activity seen with older neuroimaging modalities to fMRI. These observations suggest that individual differences affect brain responses during cognitive activity and at rest and provide evidence for the hypothesized neurobiological basis of personality.
Figures
References
-
- Barbas H, Henion TH, Dermon CR (1991) Diverse thalamic projections to the prefrontal cortex in the rhesus monkey. J Comp Neurol 313: 65-94. - PubMed
-
- Botvinick MM, Braver TS, Barch DM, Carter CS, Cohen JD (2001) Conflict monitoring and cognitive control. Psychol Rev 108: 624-652. - PubMed
-
- Callicott JH, Mattay VS, Bertolino A, Finn K, Coppola R, Frank JA, Goldberg TE, Weinberger DR (1999) Physiological characteristics of capacity constraints in working memory as revealed in functional MRI. Cereb Cortex 9: 20-26. - PubMed
-
- Canli T, Desmond JE, Zhao Z, Glover G, Gabrieli JD (1998) Hemispheric asymmetry for emotional stimuli detected with fMRI. NeuroReport 9: 3222-3239. - PubMed
-
- Canli T, Zhao Z, Desmond JE, Kang E, Gross J, Gabarieli JDE (2001) An fMRI study of personality influences on brain reactivity to emotional stimuli. Behav Neurosci 115: 33-42. - PubMed
Publication types
MeSH terms
Grants and funding
LinkOut - more resources
Full Text Sources