. 2004 Nov 24;24(47):10660-9.
doi: 10.1523/JNEUROSCI.2213-04.2004.

Neurogranin/RC3 enhances long-term potentiation and learning by promoting calcium-mediated signaling

Affiliations

Neurogranin/RC3 enhances long-term potentiation and learning by promoting calcium-mediated signaling

Kuo-Ping Huang et al. J Neurosci. .

Abstract

In neurons, neurogranin (Ng) binds calmodulin (CaM), and its binding affinity is reduced by increasing Ca2+, phosphorylation by PKC, or oxidation by oxidants. Ng concentration in the hippocampus of adult mice varied broadly (Ng+/+, 160-370 and Ng+/-, approximately 70-230 pmol/mg); the level in Ng+/+ mice is one of the highest among all neuronal CaM-binding proteins. Among Ng+/- mice, but less apparent in Ng+/+, a significant relationship existed between their hippocampal levels of Ng and performances in the Morris water maze. Ng-/- mice performed poorly in this task; they also displayed deficits in high-frequency-induced long-term potentiation (LTP) in area CA1 of hippocampal slices, whereas low-frequency-induced long-term depression was enhanced. Thus, compared with Ng+/+ mice, the frequency-response curve of Ng-/- shifted to the right. Paired-pulse facilitation and synaptic fatigue during prolonged stimulation at 10 Hz (900 pulses) were unchanged in Ng-/- slices, indicating their normal presynaptic function. Measurements of Ca2+ transients in CA1 pyramidal neurons after weak and strong tetanic stimulations (100 Hz, 400 and 1000 msec, respectively) revealed a significantly greater intracellular Ca2+ ([Ca2+]i) response in Ng+/+ compared with Ng-/- mice, but the decay time constants did not differ. The diminished Ca2+ dynamics in Ng-/- mice are a likely cause of their decreased propensity to undergo LTP. Thus, Ng may promote a high [Ca2+]i by a "mass-action" mechanism; namely, the higher the Ng concentration, the more Ng-CaM complexes will be formed, which effectively raises [Ca2+]i at any given Ca2+ influx. This mechanism provides potent signal amplification in enhancing synaptic plasticity as well as learning and memory.


Figures

Figure 1.
Figure 1.
Representative immunoblots of hippocampal Ng of Ng+/+, Ng+/-, and Ng-/- mice. Hippocampal extracts (20 μg of protein) from Ng+/+ (W), Ng+/- (H), and Ng-/- (K) along with purified Ng (10-50 ng) as standard were resolved by 10-20% SDS-PAGE and analyzed by immunoblot with Ng antibody #270. Note that Ng contents among individual Ng+/+ and Ng+/- mice are quite variable, and Ng-/- mice contain no Ng.
Figure 2.
Figure 2.
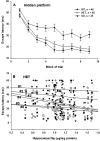
Performance of Ng+/+, Ng+/-, and Ng-/- mice in the hidden-platform task of the Morris water maze and their hippocampal Ng levels. A, Escape latency of Ng+/+ (WT; n = 46), Ng+/- [heterozygotes (HET); n = 48], and Ng-/- [knock-out (KO); n = 25] in the hidden-platform trial of the Morris water maze. Ng+/+ and Ng+/- mice attain the training criterion of reaching the platform in 20 sec after the fifth and eighth block, respectively, whereas Ng-/- mice fail to reach this criterion even after the ninth block. B, Linear regression of the escape latency versus hippocampal Ng level was compiled for the first six blocks of learning sessions for Ng+/- mice (n = 48). Relationship between hippocampal Ng level and performance of mice in the hidden-platform task was evaluated from the slope of the regression curves. For Ng+/- mice, linear regression lines for blocks 1, 2, 5, and 6 were near horizontal (r < 0.3), and negative slopes were more prominent at the third (r = 0.33) and fourth (r = 0.3) block. B, Symbols: •, block 1; ○, block 2; ▾, block 3; ▿, block 4; ▪, block 5; □, block 6.
Figure 3.
Figure 3.
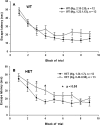
Comparison of the performances of high and low hippocampal Ng groups among Ng+/+ and Ng+/- mice in hidden-platform trial. A, Rates of learning (acquisition) among Ng+/+ mice having high and low Ng levels. Although the Ng+/+ (WT) mice having high Ng levels (75th percentile; 2.15-2.8 μg/mg; n = 12; -○-) displayed a tendency of having shorter escape latencies than those having low Ng (25th percentile; 1.22-1.63 μg/mg; n = 12; -•-), the differences between these two groups were not statistically significant. B, Rates of learning (acquisition) among Ng+/- mice having high and low Ng levels. In blocks 3 and 4, Ng+/- [heterozygotes (HET)] mice having high Ng levels (75th percentile; 1.34-1.7 μg/mg; n = 12; -○-) performed significantly better than those having low Ng levels (25th percentile; 0.46-0.98 μg/mg; n = 13; -•-). Thus, after having adapted to the training protocol, the high-Ng group of Ng+/- mice displayed a faster learning than the low-Ng group.
Figure 4.
Figure 4.
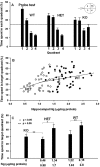
Correlation between the hippocampal Ng level and performance of the probe test. A, Time spent in each quadrant during the probe test. Percentage of time each group of mice spent in the target quadrant (#1) was as follows: Ng+/+ (WT), 42.3 ± 2.36%, n = 44; Ng+/- [heterozygote (HET)], 34.91 ± 2.46%, n = 37; and Ng-/- [knock-out (KO)], 30 ± 2.79%, n = 25. The genotype differences were significant for Ng+/+ versus Ng-/- (t test; t = 3.25; p < 0.05) and Ng+/+ versus Ng+/- (t test; t = 2.17; p < 0.05) but not significant for Ng+/- versus Ng-/- (t test; t = 1.28; p = 0.206). B, Linear regression of the time spent in the target quadrant versus the hippocampal Ng level of individual mice. The slope for Ng+/- (r = 0.41; ANOVA; F = 6.96) was greater than that of Ng+/+ (r = 0.27; ANOVA; F = 2.27) mice. C, Performances of Ng+/+ and Ng+/- mice having different hippocampal Ng levels in the probe test. Those Ng+/+ and Ng+/- mice having high Ng (Ng+/+, 2.15-2.80 μg/mg; Ng+/-, 1.34-1.70 μg/mg) performed better than their respective low Ng groups (Ng+/+, 1.22-1.63 μg/mg; Ng+/-, 0.46-0.98 μg/mg). The differences among these high-Ng and low-Ng groups were as follows: Ng+/+, high, 46 ± 4.4% (n = 10) versus low, 33.6 ± 5.1% (n = 12), t test, t = 1.8, p = 0.086; and Ng+/-, high, 42.1 ± 5.1% (n = 10) versus low, 26.9 ± 2.8% (n = 12), t test, t = 2.7, p < 0.05. The low-Ng group of Ng+/- mice performed as poorly as Ng-/- mice.
Figure 5.
Figure 5.
Frequency-responses of the fEPSP slope of adult Ng+/+ and Ng-/- mice obtained by stimulation at 1, 5, 10, and 100 Hz. Hippocampal slices from Ng+/+ and Ng-/- mice were stimulated with 900 pulses at time 0 (indicated by the arrow) with 1 Hz (A), 5 Hz (B), and 10 Hz (C) or 100 pulses at 100 Hz (D) after establishing a stable baseline. The slope of fEPSP was determined. The steady-state levels of responses between Ng+/+ and Ng-/- mice during the last 10 m in blocks were as follows (percentage of mean ± SEM of baseline): 1 Hz, Ng+/+, 89.7 ± 0.9% (n = 6) versus Ng-/-, 84.9 ± 0.6% (n = 5); 5 Hz, Ng+/+, 94.8 ± 0.9% (n = 8) versus Ng-/-, 89.8 ± 0.5% (n = 17); 10 Hz, Ng+/+, 104.6 ± 0.5% (n = 19) versus Ng-/-, 99.1 ± 0.6% (n = 18); and 100 Hz, Ng+/+, 143.4 ± 0.7% (n = 11) versus Ng-/-, 106 ± 0.5% (n = 15). The frequency-response curve of Ng-/- mice exhibited a decrease in LTP induction with minimal effect on LTD compared with those of the Ng+/+ (E). Representative traces of fEPSP before (trace 1) and 60 min after (trace 2) of recording are shown. Calibration: 1 mV, 5 msec.
Figure 6.
Figure 6.
Frequency-responses of the population spike amplitude of adult Ng+/+ and Ng-/- mice by stimulation at 1, 5, 10, and 100 Hz. After establishing a stable baseline, hippocampal slices were stimulated with 900 pulses each at time 0 (indicated by the arrow) with 1 Hz (A), 5 Hz (B), and 10 Hz (C) or with 100 pulses at 100 Hz (D). The steady-state level of responses during the last 10 min of recording between Ng+/+ and Ng-/- mice was compared, and the magnitude of population spike was as follows (% mean ± SEM of baseline): 1 Hz, Ng+/+, 87 ± 0.8% (n = 9) versus Ng-/-, 79 ± 1.9% (n = 7); 5 Hz, Ng+/+, 103 ± 1.7% (n = 8) versus Ng-/-, 87 ± 1.3% (n = 5); 10 Hz, Ng+/+, 113 ± 2.3% (n = 6) versus Ng-/-, 94 ± 1.6% (n = 7); and 100 Hz, Ng+/+, 181 ± 3.9% (n = 9) versus Ng-/-, 137 ± 3.2% (n = 7). Stimulation with 1 Hz induced LTD in both the Ng+/+ and Ng-/-, whereas 5 and 10 Hz stimulations induced modest LTP in Ng+/+ mice but LTD in Ng-/- mice, and 100 Hz induced LTP in both Ng+/+ and Ng-/- mice. The frequency-response curve of Ng-/- shifts to the right compared with Ng+/+ (E). Insets show population spikes recorded before (1) and 60 min after (2) stimulation, respectively.
Figure 7.
Figure 7.
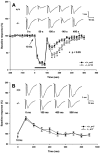
Synaptic responses during and after 10 Hz stimulation. A, Ng+/+ (n = 9) and Ng-/- (n = 13) hippocampal slices were stimulated at 10 Hz for 90 sec (underline), and the fEPSP slopes were measured at 20 sec intervals. Ng-/- and Ng+/+ exhibited the same decay kinetics (synaptic fatigue) during 10 Hz stimulation and similar levels of transient rebounce after completion of stimulation (∼80-90% of baseline at 100 sec). Afterward, Ng-/- underwent a greater depression than Ng+/+ [e.g., at 140 sec, WT, 66.3 ± 5.6% vs knock-out (KO), 44.5 ± 3.6%], followed by a gradual recovery to near baseline level. Representative traces of fEPSPs before (0 sec) and after (80, 100, 140, and 400 sec) 10 Hz stimulations are shown. B, Recordings during the first second of 10 Hz stimulation. Both genotypes exhibited the same level of PPF and synaptic fatigue. Insets show analog potential traces before (0 msec) and after (100, 400, and 900 msec) application of 10 Hz.
Figure 8.
Figure 8.
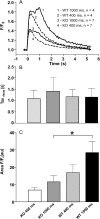
Tetanic stimulation-induced Ca2+ responses in hippocampal CA1 neurons from Ng+/+ and Ng-/- mice. A, Normalized Ca2+ transients for Ng+/+ (WT, traces 1 and 2) and Ng-/- [knock-out (KO), traces 3 and 4] hippocampal slices evoked by HFS at 100 Hz for 400 msec (traces 2 and 4) and 1000 msec (traces 1 and 3). Note the clear-cut reduction in the amplitude of Ca2+ responses in Ng-/- mice. B, The decay time constant, tau, of the Ca2+ transients of Ng+/+ and Ng-/- slices after stimulations for 400 or 1000 msec. Designation of the columns are the same as in C. C, Ca2+ responses expressed as averaged total areas of individual Ca2+ transients [given as arbitrary units (au)]. The areas of Ng+/+ mice were nearly twice as much as those of Ng-/- under both conditions.
Figure 9.
Figure 9.
Ca2+ responses in hippocampal CA1 neurons from Ng+/+ and Ng-/- mice after low-frequency stimulation. During LFS of 5 Hz for 3 min, wild types displayed a trend toward a higher initial [Ca2+]i amplitude and a larger rise-time constant than the mutant. A, Normalized Ca2+ transients for Ng+/+ (n = 3) and Ng-/- (n = 5). B, Rise-time constant tau obtained by a nonlinear fit of a one-phase exponential equation: y = a * (1 - e-t/tau) + b; Ng+/+, 1.56 ± 0.54 sec, n = 3; Ng-/-, 0.41 ± 0.108 sec, n = 5.

Similar articles

Cited by

References

    1. Bernal J, Rodriguez-Pena A, Iniguez MA, Ibarrola N, Munoz A (1992) Influence of thyroid hormone on brain gene expression. Acta Med Austriaca 19 [Suppl 1]: 32-35. - PubMed
    1. Bhalla US, Iyengar R (1999) Emergent properties of networks of biological signaling pathways. Science 283: 381-387. - PubMed
    1. Chakravarthy B, Morley P, Whitfield J (1999) Ca2+-calmodulin and protein kinase Cs: a hypothetical synthesis of their conflicting convergences on shared substrate domains. Trends Neurosci 22: 12-16. - PubMed
    1. Cimler BM, Andreasen TJ, Andreasen KI, Storm DR (1985) P-57 is a neural specific calmodulin-binding protein. J Biol Chem 260: 10784-10788. - PubMed
    1. Cohen RW, Margulies JE, Coulter II PM, Watson JB (1993) Functional consequences of expression of the neuron-specific, protein kinase C substrate RC3 (neurogranin) in Xenopus oocytes. Brain Res 627: 147-152. - PubMed

MeSH terms

LinkOut - more resources