. 2004 Dec 8;23(24):4717-26.
doi: 10.1038/sj.emboj.7600484. Epub 2004 Nov 25.

Molecular mechanism of voltage sensor movements in a potassium channel

Affiliations

Molecular mechanism of voltage sensor movements in a potassium channel

David J S Elliott et al. EMBO J. .

Abstract

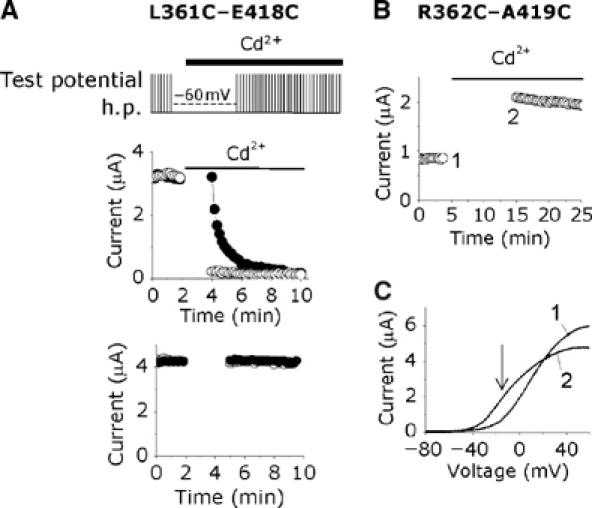
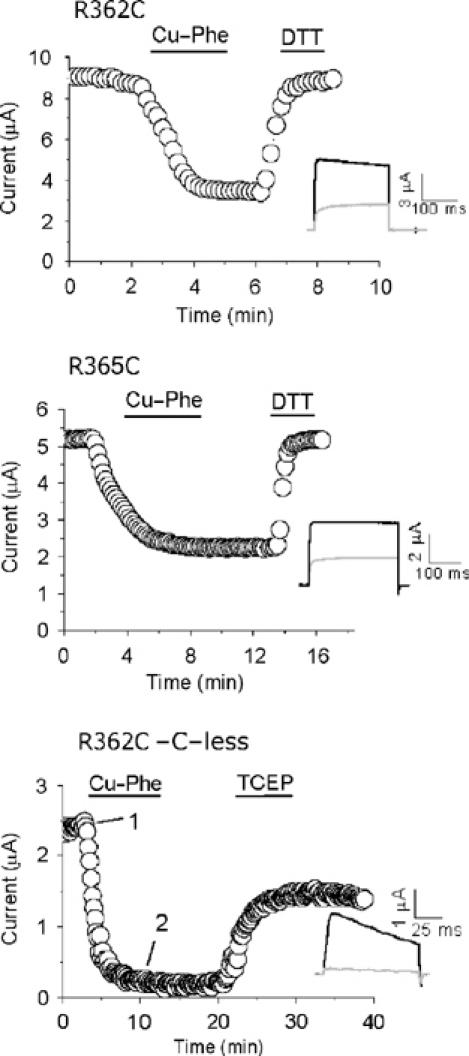
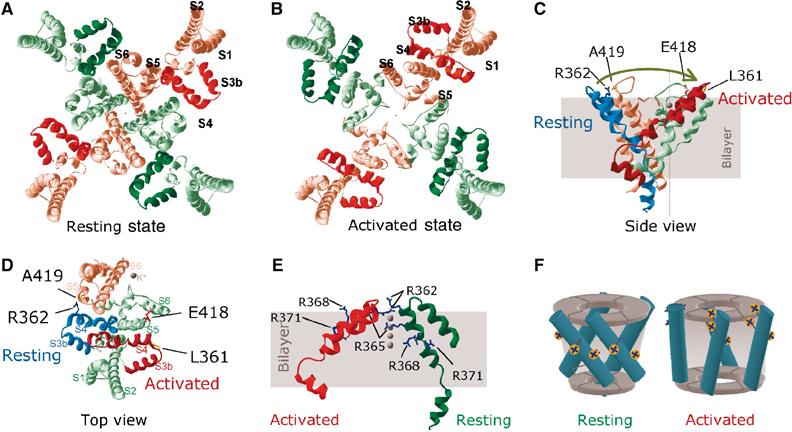
Voltage-gated potassium channels are six-transmembrane (S1-S6) proteins that form a central pore domain (4 x S5-S6) surrounded by four voltage sensor domains (S1-S4), which detect changes in membrane voltage and control pore opening. Upon depolarization, the S4 segments move outward carrying charged residues across the membrane field, thereby leading to the opening of the pore. The mechanism of S4 motion is controversial. We have investigated how S4 moves relative to the pore domain in the prototypical Shaker potassium channel. We introduced pairs of cysteines, one in S4 and the other in S5, and examined proximity changes between each pair of cysteines during activation, using Cd2+ and copper-phenanthroline, which crosslink the cysteines with metal and disulphide bridges, respectively. Modelling of the results suggests a novel mechanism: in the resting state, the top of the S3b-S4 voltage sensor paddle lies close to the top of S5 of the adjacent subunit, but moves towards the top of S5 of its own subunit during depolarization--this motion is accompanied by a reorientation of S4 charges to the extracellular phase.


Figures

Figure 1
Figure 1
Effects of Cd2+ on K+ currents through single and double cysteine mutant channels. (A) Normalized GV relationships calculated from peak currents recorded during depolarization to between −80 and 80 mV in 10 mV increments from a holding potential (h.p.) of −80 mV, before (○) and after (•) exposure to 100 μM Cd2+; interpulse interval was 20 s. The smooth curves correspond to data fitted to the Boltzmann function; n=4. (B, C) Channel activation. Representative current traces for the indicated double (B) and single (C) mutant channels, before (black) and after (grey) exposure to 100 μM Cd2+, recorded at a potential where the probability of channel opening is maximal, from an h.p. of −80 mV; interpulse interval was 20s; the insets show the time and current scale. (D) Dose–response curve for Cd2+-induced inhibition of the L361C–E418C mutant channel currents from which the EC50 value was calculated; n=4. (E) Structural models of the voltage sensor and the pore domain, based on KvAP and KcsA respectively; residues mutated are labelled.
Figure 2
Figure 2
State dependence of the Cd2+ effect. (A) State dependence of the Cd2+ effect on the L361C–E418C double cysteine mutant channel. Perfusion protocol used is shown at the top. Peak currents were measured during depolarizing (+20 mV) test pulses (25 ms) from an h.p. of −80 mV, delivered at 10 s intervals. Solid bars indicate the period over which Cd2+ was applied. Data points represent experiments in which oocytes were held at the h.p. (•) or at −60 mV (○) during the gap in measurement. The bottom panel shows data from an identical experiment, without exposure to Cd2+. Representative data are presented from a single oocyte. (B) Cd2+ binds R362C–A419C double cysteine mutant channel in the closed state. Oocytes expressing this mutant channel was pretreated with 10 mM DTT for 1 h; currents were then measured during a voltage ramp (−120 to +60 mV), given at 30 s intervals from an h.p. of −100 mV; each data point in the top panel corresponds to current at −20 mV. Gap in the measurement indicates holding at −100 mV. (C) IV relationships corresponding to data points labelled 1 and 2 (B); the arrow indicates the voltage point where currents were measured for (B).
Figure 3
Figure 3
Position 361 lies close to position 418 of its neighbouring subunit at resting potentials, but close to position 418 of its own subunit at activating potentials. (A, C) GV relationships (measured as in Figure 1) for the indicated tandem dimers before (○) and after (•) exposure to 100 μM Cd2+; the insets show current traces before (black) and after (grey) exposure to Cd2+. (B) Schematic of the expected tetrameric arrangement of the protomers in the two tandem dimers. (D) Effect of successive applications of Cu2+ (200 nM), Cu-Phe (50 μM) and DMPS (0.5 mM) on currents (measured during 100 ms pulses to 40 mV from an h.p. of −80 mV, delivered at 10 s intervals) through L361C–E418C TD (left) and L361C–E418C/WT TD (right); application of reagents is indicated by horizontal bars. (E) State dependence of disulphide bridge formation for L361C–E418C TD (left) and L361C–E418C/WT TD (right). Following control recordings, Cu-Phe was applied to channels held at −120 mV (•) and 0 mV (○) for 2 min (shown as horizontal bars). After washing while holding at −80 mV, current measurements were recommenced. (F) Effect of successive applications of Cu-Phe and DMPS on L361C-WT TD.
Figure 4
Figure 4
Intersubunit disulphide bond formation between S4 cysteines. Currents (at 40 mV; h.p. −80 mV; interpulse interval was 20 s) through R362C and R365C mutant channels in the wild-type background, and R365C in the cysteine-less Shaker background, were inhibited by Cu-Phe; the inhibition could be reversed with DTT or TCEP (solid bars indicate time periods during which reagents were applied). The insets show current traces before (black) and at the end of (grey) inhibition.
Figure 5
Figure 5
Proposed mechanism of voltage sensor paddle motion. (A, B) Structural models of resting (A) and activated (B) states of the Shaker potassium channel, reconstructed on the basis of elements derived from the crystal structures of KvAP, KcsA and MthK and the distance constraints obtained in this study (see Materials and methods and Discussion). Views are from the extracellular ends. Alternate subunits are shown in different colours, with the corresponding paddles in deeper colour; helices in one of the subunits are labelled. (C, D) Structural model depicting the possible movement of the voltage sensor paddle during activation. (C) Side view of a voltage sensor paddle with the attached S4–S5 linker in its resting state (blue) where the extracellular end of S4 is in close proximity of the top of S5 of the closed state pore subdomain (pink), belonging to the adjacent subunit. When activated, the paddle moves in the direction of the arrow towards S5 of its own pore subdomain, to attain an activated state (red), and to effect the pore subdomain to assume the open conformation (green); proximate residues are labelled. Other parts of the channel are omitted for clarity. K+ (grey spheres) are shown to indicate orientation. (D) Top view of the model in (C) with S1–S3a added to the green subdomain. (E) View of the relative positions of the voltage sensor paddle and the S4–S5 linker from adjacent subunits, one in the resting (green) and the other in the activated (red) state, highlighting reorientation of positive charges from an intracellular aspect to an extracellular one. All models were built using SWISS-MODEL (Schwede et al, 2003). (F) Schematic representation of changes in the position of S4 helices (cylinders) relative to the central pore domain and the orientation of positively charged groups during activation from the resting (left) to the activated (right) state.

Similar articles

Cited by

References

    1. Aggarwal SK, MacKinnon R (1996) Contribution of the S4 segment to gating charge in the Shaker K+ channel. Neuron 16: 1169–1177 - PubMed
    1. Ahern CA, Horn R (2004a) Specificity of charge-carrying residues in the voltage sensor of potassium channels. J Gen Physiol 123: 205–216 - PMC - PubMed
    1. Ahern CA, Horn R (2004b) Stirring up controversy with a voltage sensor paddle. Trends Neurosci 27: 303–307 - PubMed
    1. Aziz QH, Partridge CJ, Munsey TS, Sivaprasadarao A (2002) Depolarization induces intersubunit cross-linking in a S4 cysteine mutant of the Shaker potassium channel. J Biol Chem 277: 42719–42725 - PubMed
    1. Baker OS, Larsson HP, Mannuzzu LM, Isacoff EY (1998) Three transmembrane conformations and sequence-dependent displacement of the S4 domain in Shaker K+ channel gating. Neuron 20: 1283–1294 - PubMed

Publication types

MeSH terms