. 2004 Nov 27:4:51.
doi: 10.1186/1471-2148-4-51.

Structure and evolution of protein interaction networks: a statistical model for link dynamics and gene duplications

Affiliations

Structure and evolution of protein interaction networks: a statistical model for link dynamics and gene duplications

Johannes Berg et al. BMC Evol Biol. .

Abstract

Background: The structure of molecular networks derives from dynamical processes on evolutionary time scales. For protein interaction networks, global statistical features of their structure can now be inferred consistently from several large-throughput datasets. Understanding the underlying evolutionary dynamics is crucial for discerning random parts of the network from biologically important properties shaped by natural selection.

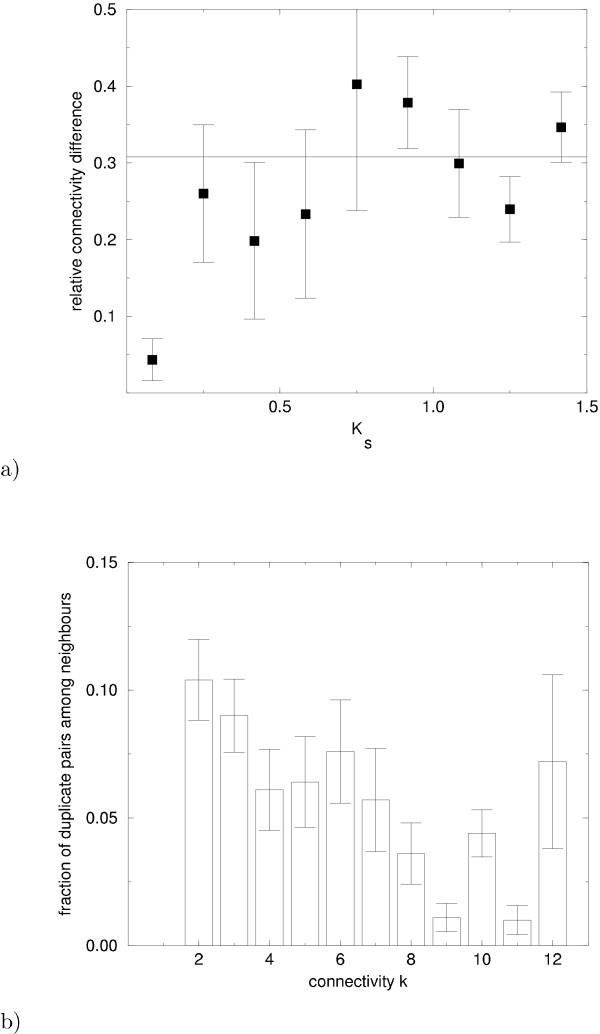
Results: We present a detailed statistical analysis of the protein interactions in Saccharomyces cerevisiae based on several large-throughput datasets. Protein pairs resulting from gene duplications are used as tracers into the evolutionary past of the network. From this analysis, we infer rate estimates for two key evolutionary processes shaping the network: (i) gene duplications and (ii) gain and loss of interactions through mutations in existing proteins, which are referred to as link dynamics. Importantly, the link dynamics is asymmetric, i.e., the evolutionary steps are mutations in just one of the binding parters. The link turnover is shown to be much faster than gene duplications. Both processes are assembled into an empirically grounded, quantitative model for the evolution of protein interaction networks.

Conclusions: According to this model, the link dynamics is the dominant evolutionary force shaping the statistical structure of the network, while the slower gene duplication dynamics mainly affects its size. Specifically, the model predicts (i) a broad distribution of the connectivities (i.e., the number of binding partners of a protein) and (ii) correlations between the connectivities of interacting proteins, a specific consequence of the asymmetry of the link dynamics. Both features have been observed in the protein interaction network of S. cerevisiae.


Figures

Figure 1
Figure 1
The elementary processes of protein network evolution. The progression of time is symbolized by arrows. (a) Link attachment and (b) link detachment occur through nucleotide substitutions in the gene encoding an existing protein. These processes affect the connectivities of the protein whose coding sequence undergoes mutation (shown in black) and of one of its binding partners (shown in gray). Empirical data shows that attachment occurs preferentially towards partners of high connectivity, cf. fig. 3. (c) Gene duplication usually produces a pair of nodes (shown in black) with initially identical binding partners (shown in gray). Empirical data suggests duplications occur at a much lower rate than link dynamics and that redundant links are lost subsequently (often in an asymmetric fashion), which affects the connectivities of the duplicate pair and of all its binding partners [22,25,38].
Figure 2
Figure 2
(a) Duplicate protein pairs lose their connectivity correlations over time. The average relative connectivity difference |k - k'|/(k + k') of duplicate pairs with connectivities k, k' > 0 is plotted against the time since duplication, parameterized by the synonymous (silent) nucleotide divergence Ks. The horizontal line indicates the value expected for two randomly chosen nodes. The average number of duplicate pairs per bin was 16 (from low values of Ks to high ones the number of duplicate pairs per bin were 12, 5, 3, 6, 6, 8, 13, 27, 44 respectively). (b) Duplications do not strongly influence network structure. The histogram shows the fraction of duplicate pairs among the k(k - 1)/2 neighbor pairs of a node of connectivity k plotted versus k. A high number of duplicate pairs would be expected if duplications were a significant mechanism of link gain, see text. The mean and the standard error of this fraction were determined using proteins which are products of duplicate genes with sequence similarity Ka < 1. The number of vertices used per column ranges from 374 for k = 2 to 8 for k = 12.
Figure 3
Figure 3
Link attachment occurs preferentially towards proteins of high connectivity. (a) The color-coded plot shows the fraction of duplicate pairs with connectivities (k, k') that have gained a mutual interaction (cross-interaction) since duplication, as a function of k and k'. Points where all duplicate pairs have cross-interactions are shown in white, points where none carry a cross-interactions are shown black. Points (particularly at high connectivities) where no data is available are also shown in black. The number of duplicate pairs with given connectivities ranges from 2 to 39. Points in the k, k'-plane where only a single pair of duplicates exists are excluded. (b) For this histogram the data from a) are binned for low, medium, and high k + k' and the average for each bin is shown against k + k'. The number of k, k' values contributing to each bin are 10, 14, and 11, from left to right. Error bars give the standard error. (c) Assuming the functional form fk + fk' for the probability of a cross-interaction between nodes with connectivities k and k' (asymmetric attachment), the most likely values of fk may be deduced from the data (see text). The maximum-likelihood result shows an approximately linear increase of fk with k. The alternative scenario, symmetric attachment, yields a smaller maximum likelihood. Only duplicate pairs with Ka ≤ 0.4 were used in this analysis in order to avoid overcounting of cross-interactions of duplicates of even older duplicates.
Figure 4
Figure 4
(a) The asymmetric link dynamics produces a broad connectivity distribution. The model prediction of the connectivity distribution of nodes with non-zero connectivity agrees well with yeast protein interaction data (filled diamonds). The solution of the rate equation (4) is shown as a solid line, the result of a computer simulation emulating the link dynamics encapsulated in (4) for a network of finite size is shown as circles (°). Nodes with the highest k (lower right) occur only once in the network. (b) High-connectivity vertices are preferentially connected to low-connectivity vertices, as also observed empirically. The figure shows the relative likelihood of the link distribution formula image 
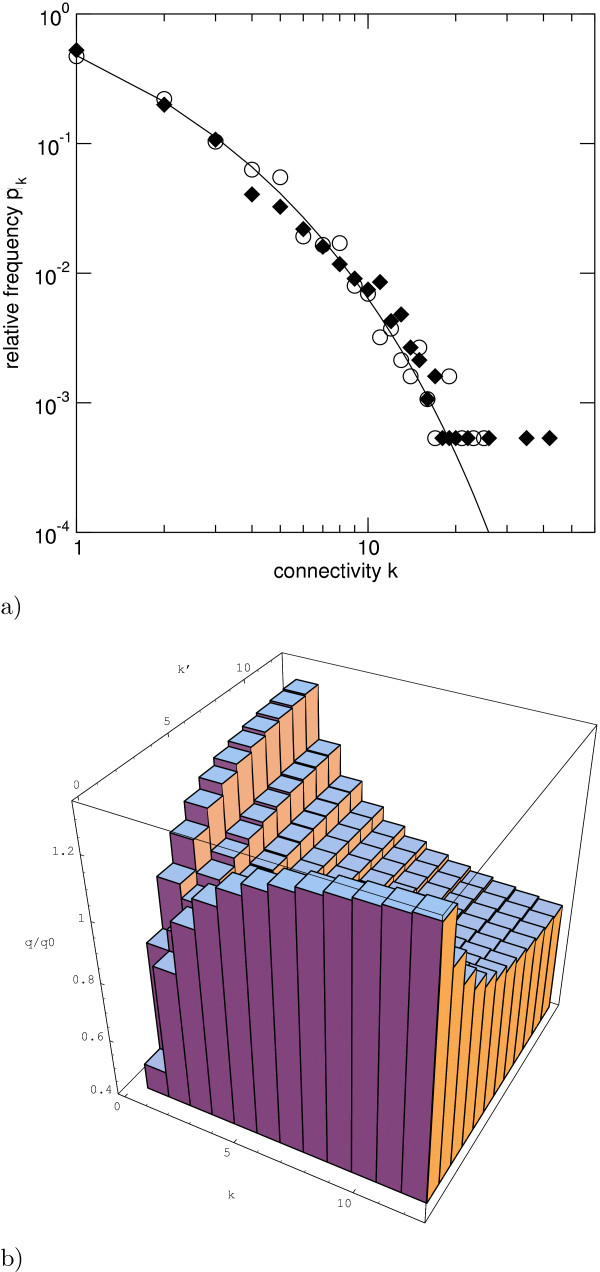
and the 'null distribution' formula image of an uncorrelated random network, see text.

References

    1. See, e.g http://wwwmgs.bionet.nsc.ru/mgs/gnw/genenet
    1. See, e.g http://igweb.integratedgenomics.com/IGwit
    1. Albert R, Barabási AL. Statistical mechanics of complex networks. Rev Mod Phys. 2002;74:47–97. doi: 10.1103/RevModPhys.74.47. - DOI
    1. Dorogovtsev SN, Mendes JFF. Evolution of Networks. Adv Phys. 2002;51:1079–1187. doi: 10.1080/00018730110112519. - DOI
    1. Newman MEJ. The structure and function of complex networks. SIAM Review. 2003;45:167–256.

Publication types

Substances

LinkOut - more resources