

Natural variation in cardiac metabolism and gene expression in Fundulus heteroclitus
- PMID: 15568023
- PMCID: PMC1447534
- DOI: 10.1038/ng1483
Natural variation in cardiac metabolism and gene expression in Fundulus heteroclitus
Abstract
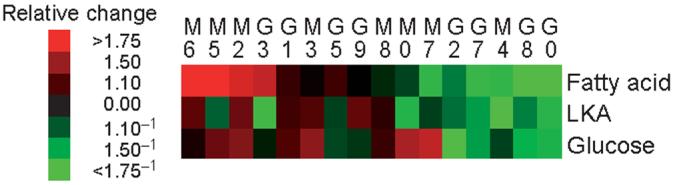
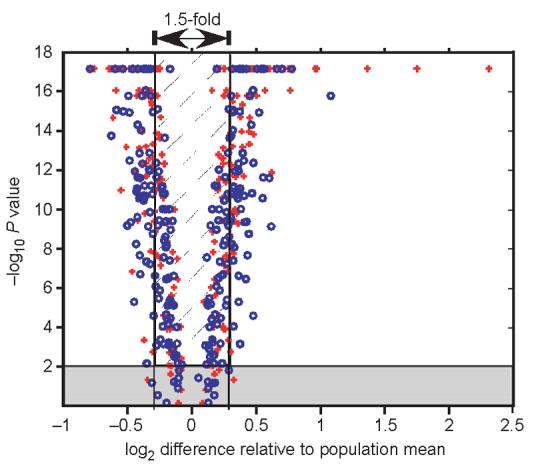
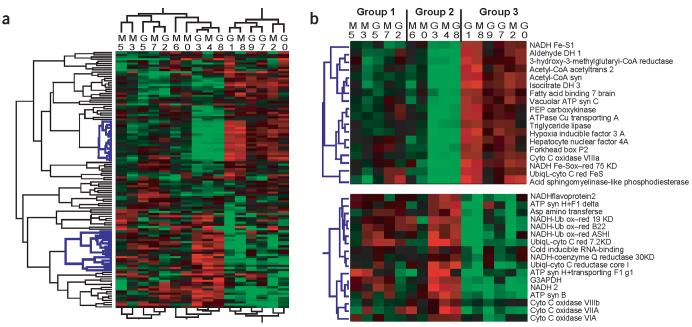
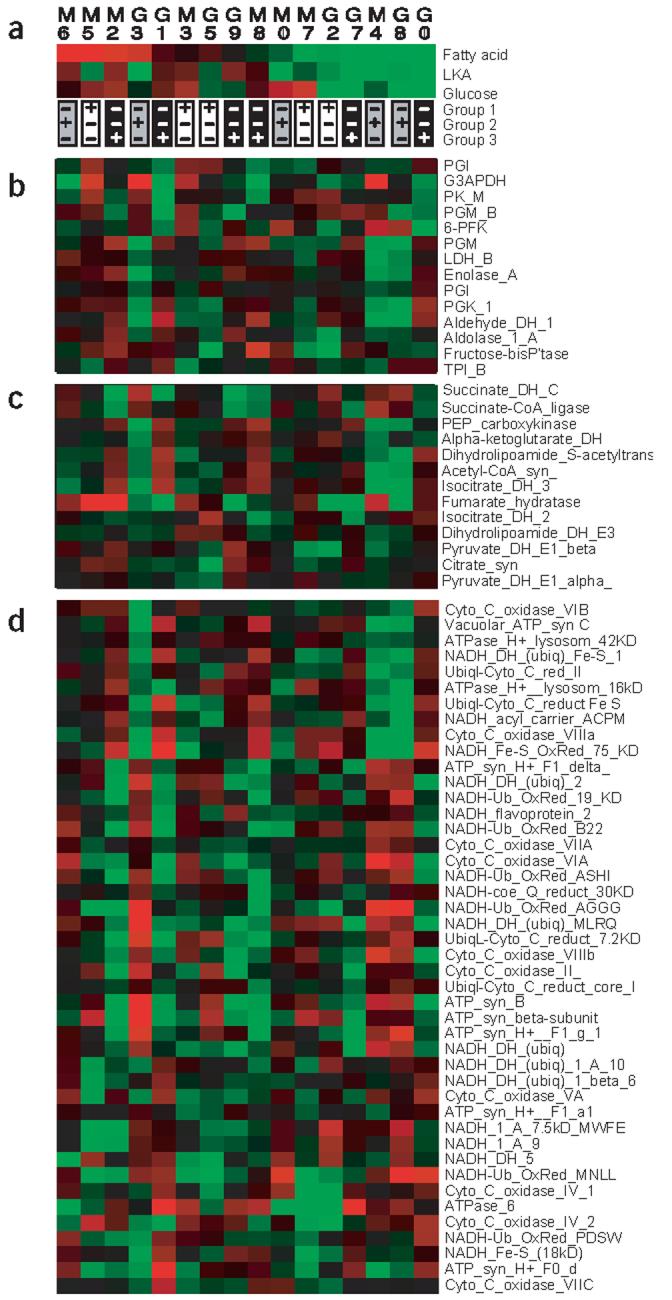
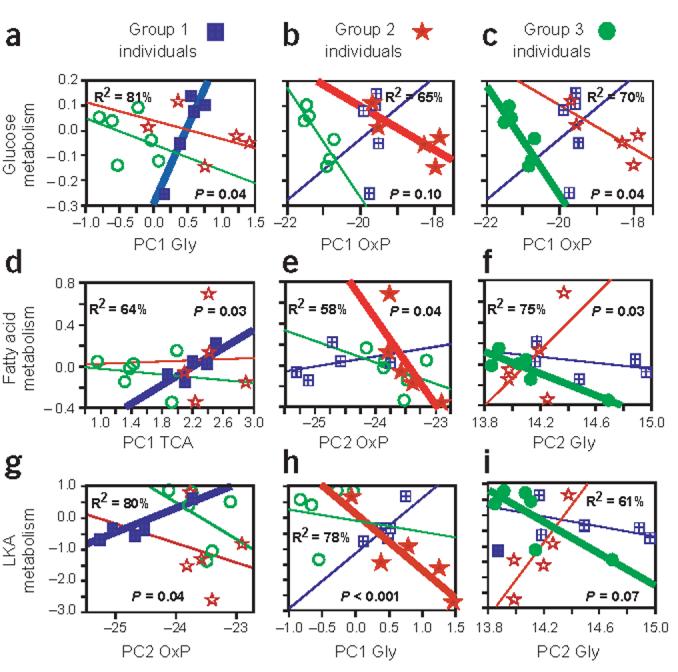
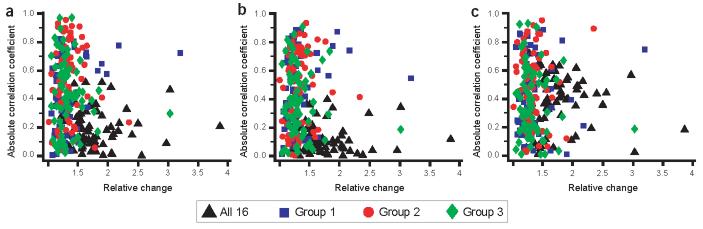
Individual variation in gene expression is important for evolutionary adaptation and susceptibility to diseases and pathologies. In this study, we address the functional importance of this variation by comparing cardiac metabolism to patterns of mRNA expression using microarrays. There is extensive variation in both cardiac metabolism and the expression of metabolic genes among individuals of the teleost fish Fundulus heteroclitus from natural outbred populations raised in a common environment: metabolism differed among individuals by a factor of more than 2, and expression levels of 94% of genes were significantly different (P < 0.01) between individuals in a population. This unexpectedly high variation in metabolic gene expression explains much of the variation in metabolism, suggesting that it is biologically relevant. The patterns of gene expression that are most important in explaining cardiac metabolism differ between groups of individuals. Apparently, the variation in metabolism seems to be related to different patterns of gene expression in the different groups of individuals. The magnitude of differences in gene expression in these groups is not important; large changes in expression have no greater predictive value than small changes. These data suggest that variation in physiological performance is related to the subtle variation in gene expression and that this relationship differs among individuals.
Figures
Similar articles
-
The biological importance of measuring individual variation.J Exp Biol. 2007 May;210(Pt 9):1613-21. doi: 10.1242/jeb.005454. J Exp Biol. 2007. PMID: 17449827
-
Variation in tissue-specific gene expression among natural populations.Genome Biol. 2005;6(2):R13. doi: 10.1186/gb-2005-6-2-r13. Epub 2005 Jan 26. Genome Biol. 2005. PMID: 15693942 Free PMC article.
-
Convergence and divergence in gene expression among natural populations exposed to pollution.BMC Genomics. 2007 Apr 25;8:108. doi: 10.1186/1471-2164-8-108. BMC Genomics. 2007. PMID: 17459166 Free PMC article.
-
Evolutionary Physiology and Genomics in the Highly Adaptable Killifish (Fundulus heteroclitus).Compr Physiol. 2020 Mar 12;10(2):637-671. doi: 10.1002/cphy.c190004. Compr Physiol. 2020. PMID: 32163195 Review.
-
The relationship between phenotypic and environmental variation: do physiological responses reduce interindividual differences?Physiol Biochem Zool. 2012 Nov-Dec;85(6):572-84. doi: 10.1086/666904. Epub 2012 Jul 31. Physiol Biochem Zool. 2012. PMID: 23099455 Review.
Cited by
-
High natural gene expression variation in the reef-building coral Acropora millepora: potential for acclimative and adaptive plasticity.BMC Genomics. 2013 Apr 8;14:228. doi: 10.1186/1471-2164-14-228. BMC Genomics. 2013. PMID: 23565725 Free PMC article.
-
Gene expression underlying parenting and being parented shows limited plasticity in response to different ambient temperatures.Mol Ecol. 2022 Oct;31(20):5326-5338. doi: 10.1111/mec.16649. Epub 2022 Aug 25. Mol Ecol. 2022. PMID: 35951025 Free PMC article.
-
Embryonic gene expression among pollutant resistant and sensitive Fundulus heteroclitus populations.Aquat Toxicol. 2010 Jul 1;98(3):221-229. doi: 10.1016/j.aquatox.2010.02.022. Epub 2010 Mar 10. Aquat Toxicol. 2010. PMID: 20363516 Free PMC article.
-
Evolution of gene regulatory networks by fluctuating selection and intrinsic constraints.PLoS Comput Biol. 2010 Aug 5;6(8):e1000873. doi: 10.1371/journal.pcbi.1000873. PLoS Comput Biol. 2010. PMID: 20700492 Free PMC article.
-
Neutral and adaptive variation in gene expression.Proc Natl Acad Sci U S A. 2006 Apr 4;103(14):5425-30. doi: 10.1073/pnas.0507648103. Epub 2006 Mar 27. Proc Natl Acad Sci U S A. 2006. PMID: 16567645 Free PMC article.
References
-
- Pierce VA, Crawford DL. Phylogenetic analysis of glycolytic enzyme expression. Science. 1997;276:256–259. - PubMed
-
- Alizadeh AA, et al. Distinct types of diffuse large B-cell lymphoma identified by gene expression profiling. Nature. 2000;403:503–511. - PubMed
-
- Oleksiak MF, Churchill GA, Crawford DL. Variation in gene expression within and among natural populations. Nat. Genet. 2002;32:261–266. - PubMed
Publication types
MeSH terms
Grants and funding
LinkOut - more resources
Full Text Sources
Other Literature Sources
