Comparative Study
. 2004 Dec;3(6):379-89.
doi: 10.1111/j.1474-9728.2004.00127.x.

Aging activates adipogenic and suppresses osteogenic programs in mesenchymal marrow stroma/stem cells: the role of PPAR-gamma2 transcription factor and TGF-beta/BMP signaling pathways

Affiliations
Comparative Study

Aging activates adipogenic and suppresses osteogenic programs in mesenchymal marrow stroma/stem cells: the role of PPAR-gamma2 transcription factor and TGF-beta/BMP signaling pathways

Elena J Moerman et al. Aging Cell. 2004 Dec.

Abstract

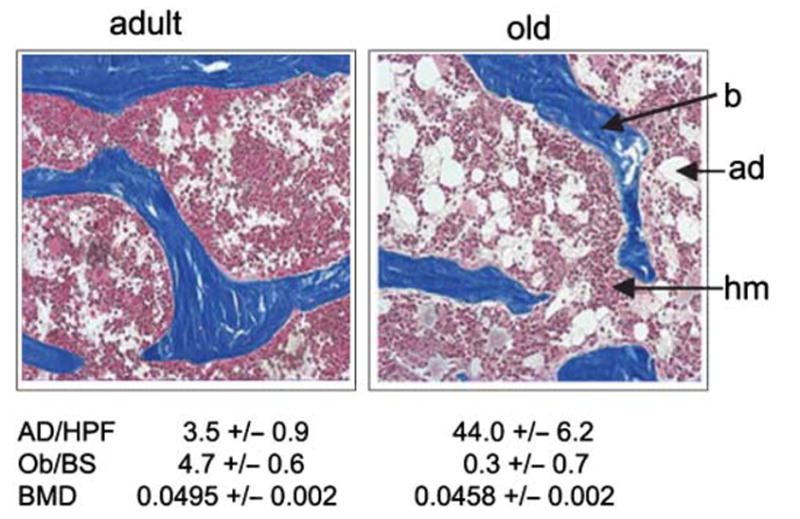
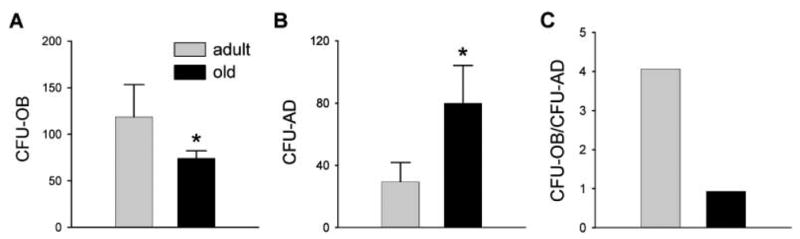
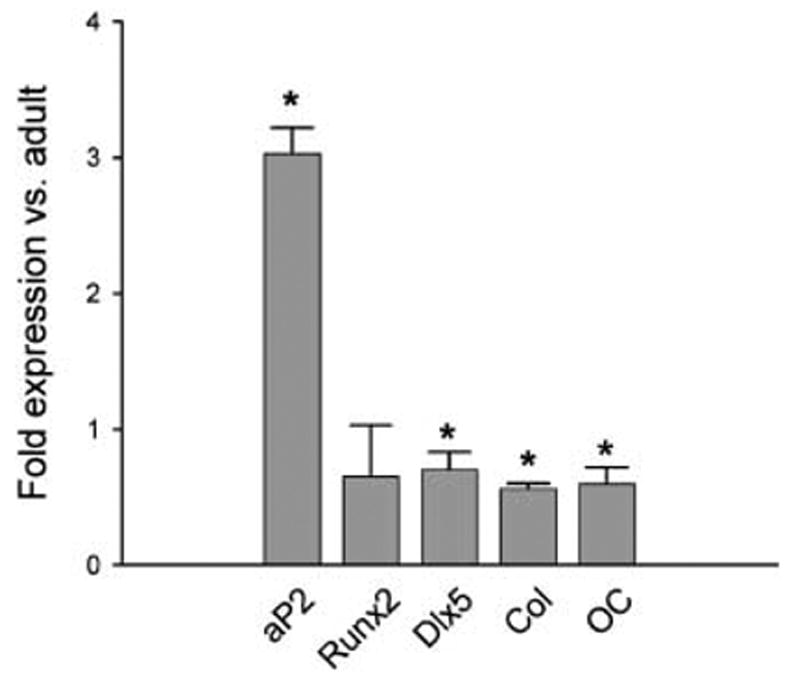
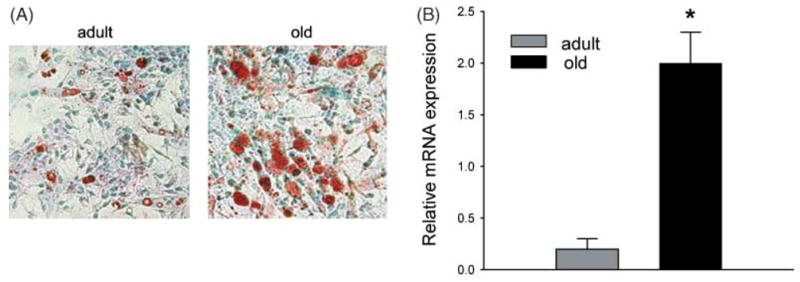
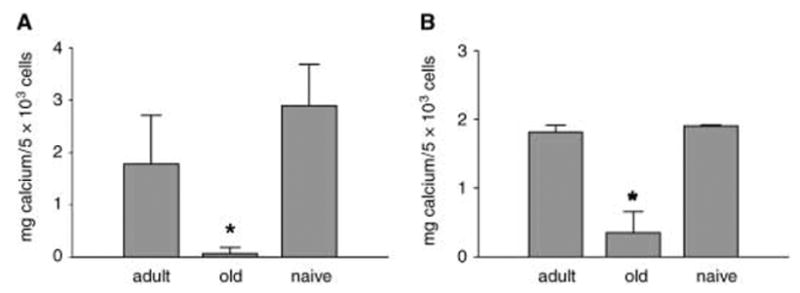
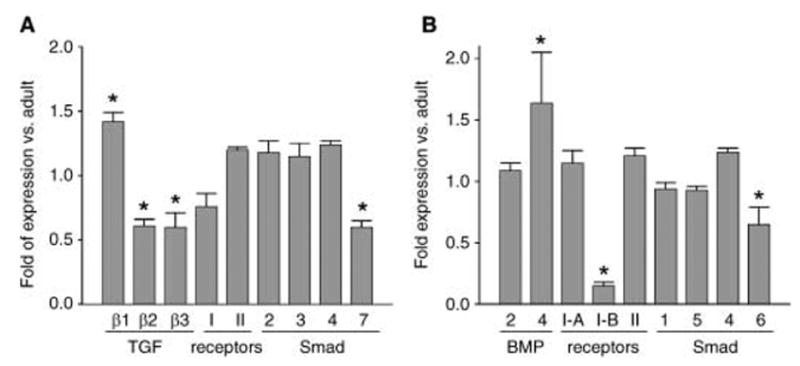
Osteoblasts and adipocytes originate from a common progenitor, which arises from bone marrow mesenchymal stroma/stem cells (mMSC). Aging causes a decrease in the number of bone-forming osteoblasts and an increase in the number of marrow adipocytes. Here, we demonstrate that, during aging, the status of mMSC changes with respect to both their intrinsic differentiation potential and production of signaling molecules, which contributes to the formation of a specific marrow microenvironment necessary for maintenance of bone homeostasis. Aging causes a decrease in the commitment of mMSC to the osteoblast lineage and an increase in the commitment to the adipocyte lineage. This is reflected by changes in the expression of phenotype-specific gene markers. The expression of osteoblast-specific transcription factors, Runx2 and Dlx5, and osteoblast markers, collagen and osteocalcin, is decreased in aged mMSC. Conversely, the expression of adipocyte-specific transcription factor PPAR-gamma2, shown previously to regulate osteoblast development and bone formation negatively and to regulate marrow adipocyte differentiation positively, is increased, as is a gene marker of adipocyte phenotype, fatty acid binding protein aP2. Furthermore, production of an endogenous PPAR-gamma activator(s) that stimulates adipocyte differentiation and production of autocrine/paracrine factor(s) that suppresses the osteoblastic phenotype are also increased. In addition, expression of different components of TGF-beta and BMP2/4 signaling pathways is altered, suggesting that activities of these two cytokines essential for bone homeostasis change with aging.


Figures

Fig. 1
Fig. 1
Histological examination of proximal tibiae sections of 8-month- and 26-month-old C57BL/6 mice. Vertical sections of undecalcified tibiae specimens were stained with Masson Trichrome, and images were taken at 4× magnification. The number of osteoblasts at the osteoid sites and the number of adipocytes were determined in six randomly chosen microscopic fields per specimen and calculated as the average of eight animals per group (± SD). b, bone: ad, adipocytes; hm, haematopoietic marrow; AD/HPF, number of adipocytes per field at 20× magnification; Ob/BS, number of osteoblasts per osteoid; BMD, bone mineral density.
Fig. 2
Fig. 2
Formation of osteoblastic (CFU-OB) and adipocytic (CFU-AD) colonies in primary bone marrow cultures. Primary bone marrow cell cultures were prepared from 8-month- and 26-month-old C57BL/6 mice. Cells from each animal were cultured separately and examined for the formation of: (A) colonies containing mineralized bone nodules (CFU-OB), which developed in osteoblastic medium; (B) colonies containing fat laden cells (CFU-AD), which developed in adipogenic medium; and (C) ratio of CFU-OB to CFU-AD formation. Each bar represents the average from eight animals; the number of colonies was calculated per 2.5 × 10⁶ plated cells. Error bars indicate SD. Shaded bars, 8-month-old; black bars, 26-month-old animals. *P < 0.05.
Fig. 3
Fig. 3
Gene expression of adipocyte and osteoblast markers in mMSC derived from 6-month- and 20-month-old mice. Gene expression was determined using quantitative real-time RT-PCR as described in Experimental procedures. Values were normalized to the expression of GAPDH, and expression in old marrow (20-month-old) is presented as the fold increase or decrease of that in adult marrow (6-month-old). Error bars represent SD. Col, collagen; OC, osteocalcin. *P < 0.05.
Fig. 4
Fig. 4
Effects of aging on mMSC sensitivity to rosiglitazone and expression of PPAR-γ2 transcription factor. (A) Photomicrographs (40× magnification) show a response to 5 μM rosiglitazone treatment of mMSC derived from adult (6-month-old) and old (20-month-old) mice. Cells stained with Oil Red O (red) for fat and counterstained with methyl green (blue). (B) Expression of PPAR-γ2 in mMSC derived from 6-month- and 20-month-old mice. mMSC were grown for 10 days in basal medium followed by RNA isolation and analysis of PPAR-γ2 expression using quantitative real-time RT-PCR. Values were normalized to the expression of 18S rRNA, and bars represent average expression from three independent experiments; error bars indicate SD. Shaded bars, 6-month-old; black bars, 20-month-old. *P < 0.001.
Fig. 5
Fig. 5
Effects of bone marrow-conditioned media on osteoblast differentiation of U-33/γ2 (A) and U-33/c cells (B). Cell cultures of U-33/γ2 and U-33/c were fed with conditioned media collected from 16th-day primary bone marrow cultures from adult (6-month) and old (20-month) animals, or naïve (non-conditioned medium), freshly supplemented with ascorbic acid and β-glycerophosphate as described in Experimental procedures. After 6 days of treatment extracellular calcium content was measured. *P < 0.05.
Fig. 6
Fig. 6
Expression analysis of components of TGF-β (A) and BMP2/4 (B) signaling pathways in mMSCs derived from adult (6-month) and old (20-month) mice. Quantitative real-time RT-PCR was performed as described in Experimental procedures. Values were normalized to the expression of GAPDH, and expression in mMSC from old mice is presented as fold increase or decrease of that in adult animals. Error bars indicate SD. *P < 0.001.

References

    1. Abe E, Yamamoto M, Taguchi Y, Lecka-Czernik B, O’Brian CA, Economides AN, Stahl N, Jilka RL, Manolagas SC. Essential requirement of BMPs-2/4 for both osteoblast and osteoclast formation in murine bone marrow cultures from adult mice: antagonism by noggin. J Bone Miner Res. 2000;15:663–673. - PubMed
    1. Akune T, Ohba S, Kamekura S, Yamaguchi M, Chung UI, Kubota N, Terauchi Y, Harada Y, Azuma Y, Nakamura K, Kadowaki T, Kawaguchi H. PPARgamma insufficiency enhances osteogenesis through osteoblast formation from bone marrow progenitors. J Clin Invest. 2004;113:846–855. - PMC - PubMed
    1. Alliston T, Choy L, Ducy P, Karsenty G, Derynck R. TGF-beta-induced repression of CBFA1 by Smad3 decreases cbfa1 and osteocalcin expression and inhibits osteoblast differentiation. EMBO J. 2001;20:2254–2272. - PMC - PubMed
    1. Banerjee C, Javed A, Choi JY, Green J, Rosen V, van Wijnen AJ, Stein JL, Lian JB, Stein GS. Differential regulation of the two principal Runx2/Cbfa1 n-terminal isoforms in response to bone morphogenetic protein-2 during development of the osteoblast phenotype. Endocrinology. 2001;142:4026–4039. - PubMed
    1. Bianco P, Riminucci M, Gronthos S, Robey PG. Bone marrow stromal stem cells: nature, biology, and potential applications. Stem Cells. 2001;19:180–192. - PubMed

Publication types

MeSH terms