

Effects of weight-loss by exercise and by diet on apolipoproteins A-I and A-II and the particle-size distribution of high-density lipoproteins in men
- PMID: 1556953
- PMCID: PMC2834280
- DOI: 10.1016/0026-0495(92)90082-l
Effects of weight-loss by exercise and by diet on apolipoproteins A-I and A-II and the particle-size distribution of high-density lipoproteins in men
Abstract
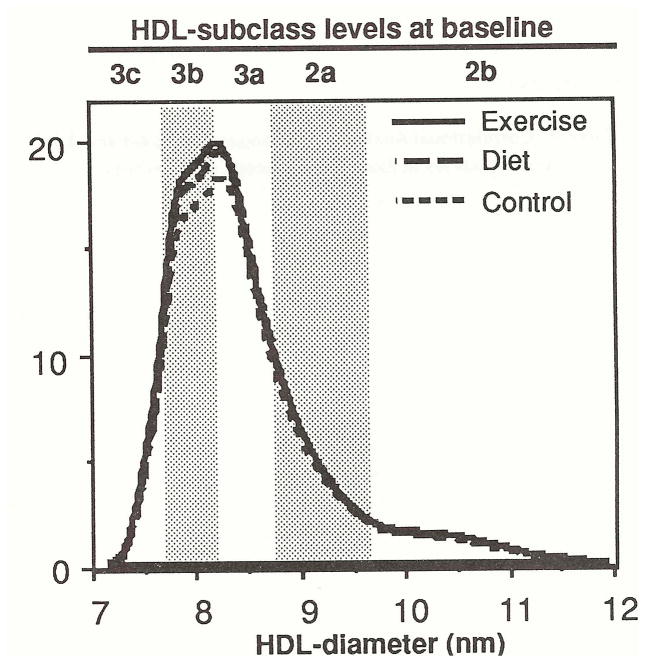
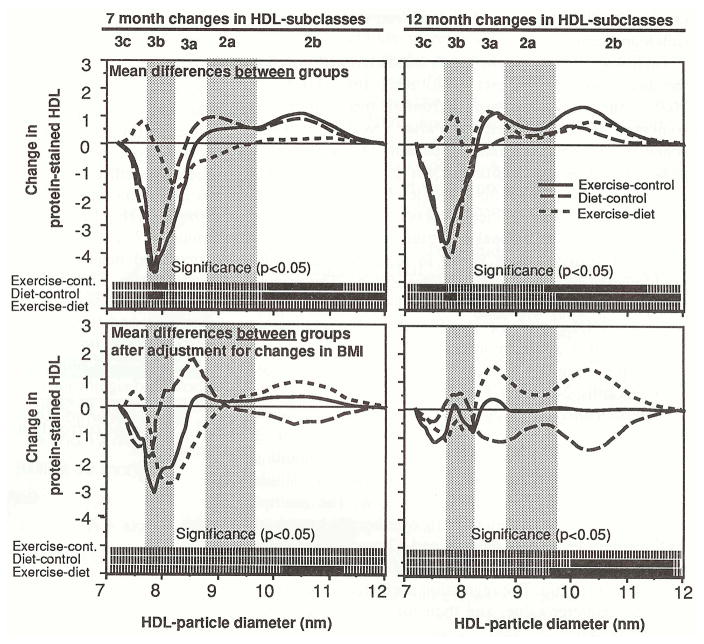
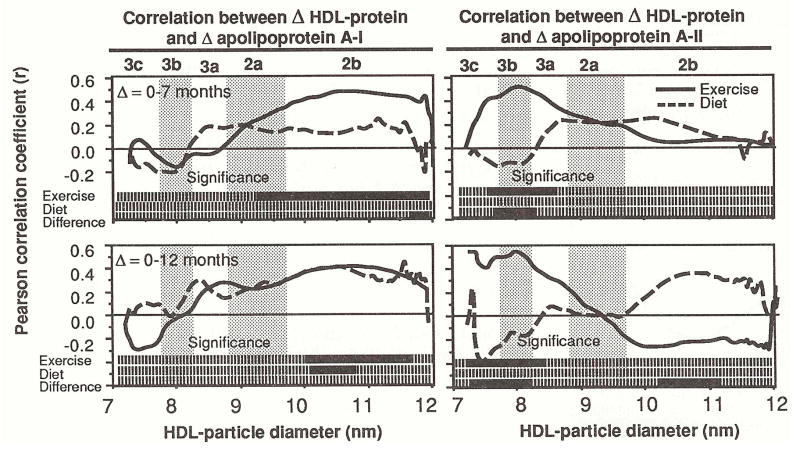
We studied separately the effects of weight-loss by dieting or by running on apolipoprotein (apo) A-I, apo A-II, and high-density lipoprotein (HDL) subfractions in sedentary, moderately overweight men assigned at random into three groups: exercise without calorie restriction, calorie restriction without exercise, and control. The absorbance of protein-stained polyacrylamide gradient gels was used as an index of mass concentrations for five HDL subclasses that have been identified by their particle sizes: HDL3c (7.2 to 7.8 nm), HDL3b (7.8 to 8.2 nm), HDL3a (8.2 to 8.8 nm), HDL2a (8.8 to 9.7 nm), and HDL2b (9.7 to 12.9 nm). During the 1-year trial, the exercisers ran (mean +/- SD) 15.6 +/- 9.1 km/wk, and the dieters reported eating 340 +/- 71 fewer calories per day than at baseline. Total body weight and fat weight were both reduced significantly more in dieters (-7.2 +/- 4.1 and -6.2 +/- 4.1 kg, respectively) and in exercisers (-4.0 +/- 3.9 and -4.6 +/- 3.5 kg) than in controls (0.6 +/- 3.7 and -0.7 +/- 2.7 kg). As compared with mean changes in controls, exercisers and dieters each decreased HDL3b and increased HDL2b. Exercisers also significantly increased plasma apo A-I concentrations. Analysis of covariance was used to statistically adjust the mean lipoprotein changes for the effects of weight-loss. The adjustment eliminated the significant reductions in HDL3b and the significant increases in HDL2b in exercisers and dieters, and it eliminated the significant increase in apo A-I in exercisers. When adjusted, the dieters' mean changes in HDL2b had significantly decreased relative to those of both exercisers and controls.(ABSTRACT TRUNCATED AT 250 WORDS)
Figures
References
-
- Wood PD, Stefanick ML, Dreon D, et al. Changes in plasma lipids and lipoproteins in overweight men during weight loss through dieting as compared with exercise. N Engl J Med. 1988;319:1173–1179. - PubMed
-
- Williams PT, Krauss RM, Vranizan KM, et al. Changes in lipoprotein subfractions during diet-induced and exercise-induced weight loss in moderately overweight men. Circulation. 1990;81:1293–1304. - PubMed
-
- Blanche PJ, Gong EL, Forte TM, et al. Characterization of human high-density lipoproteins by gradient gel electrophoresis. Biochim Biophys Acta. 1981;665:408–419. - PubMed
Publication types
MeSH terms
Substances
Grants and funding
LinkOut - more resources
Full Text Sources
Medical
Research Materials
Miscellaneous
