. 2004 Dec;124(6):679-90.
doi: 10.1085/jgp.200409111.

On the importance of atomic fluctuations, protein flexibility, and solvent in ion permeation

Affiliations

On the importance of atomic fluctuations, protein flexibility, and solvent in ion permeation

Toby W Allen et al. J Gen Physiol. 2004 Dec.

Abstract

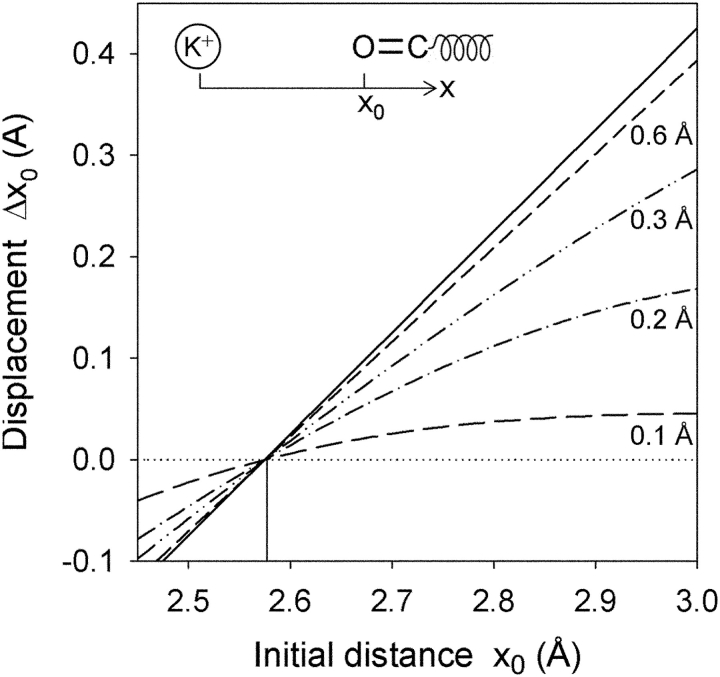
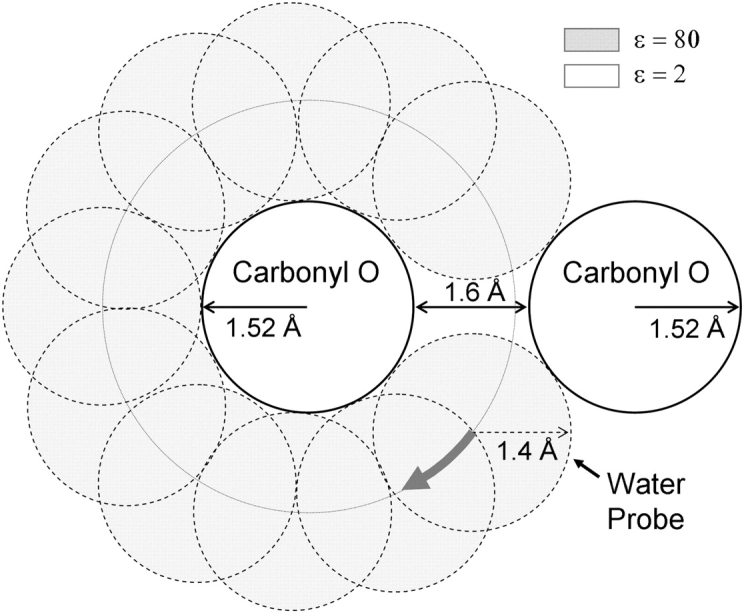
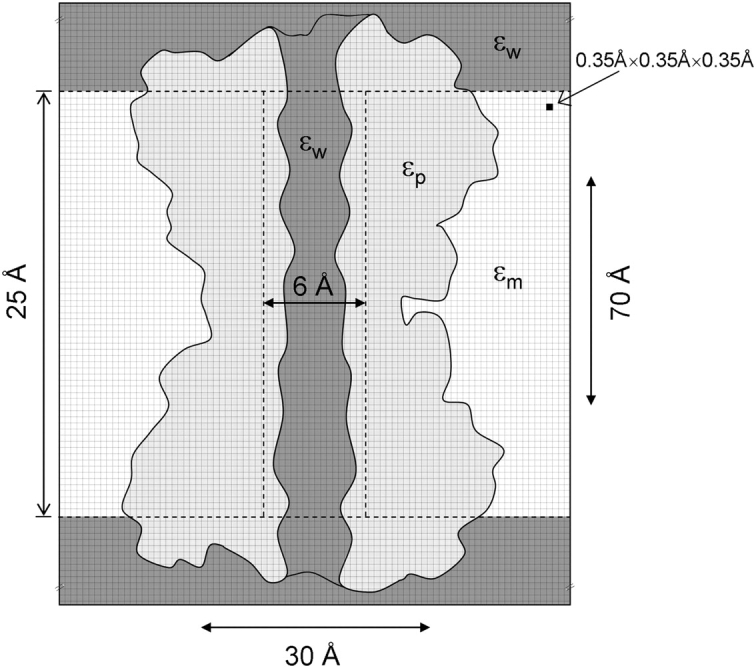
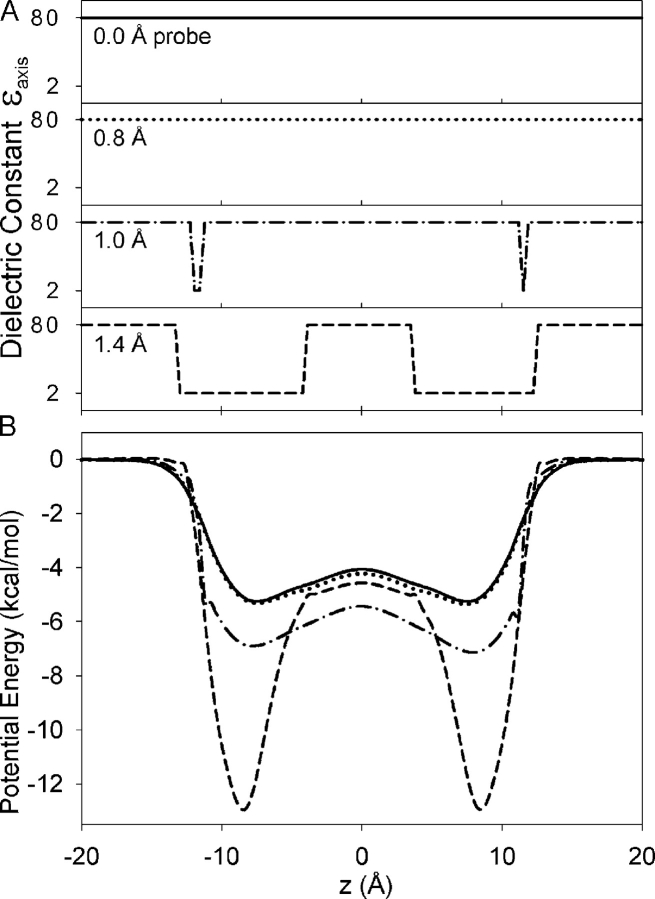
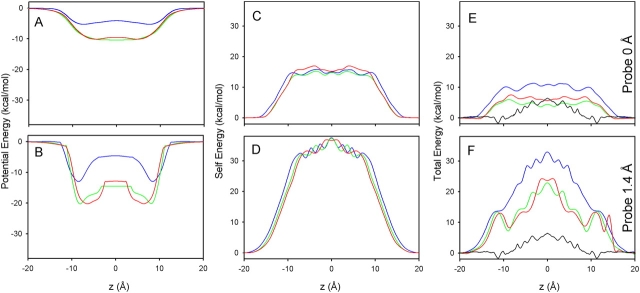
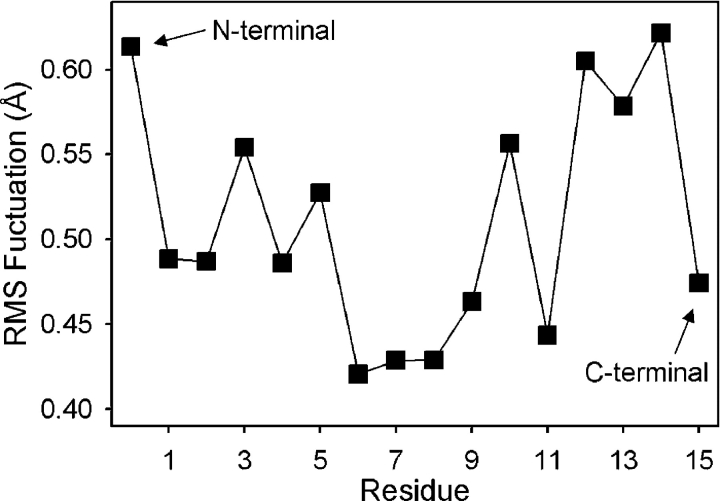
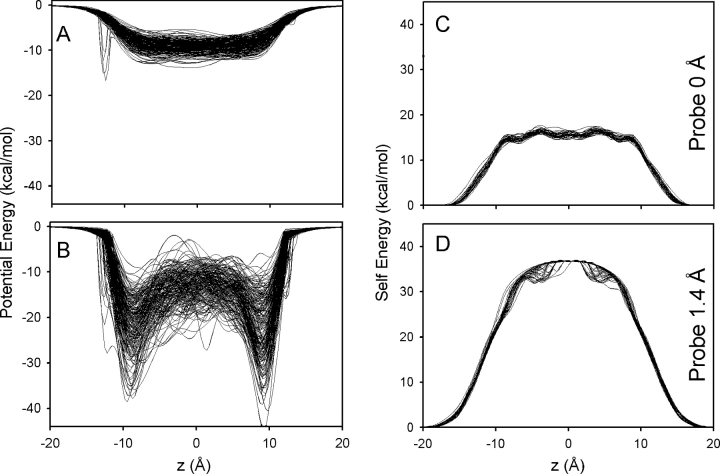
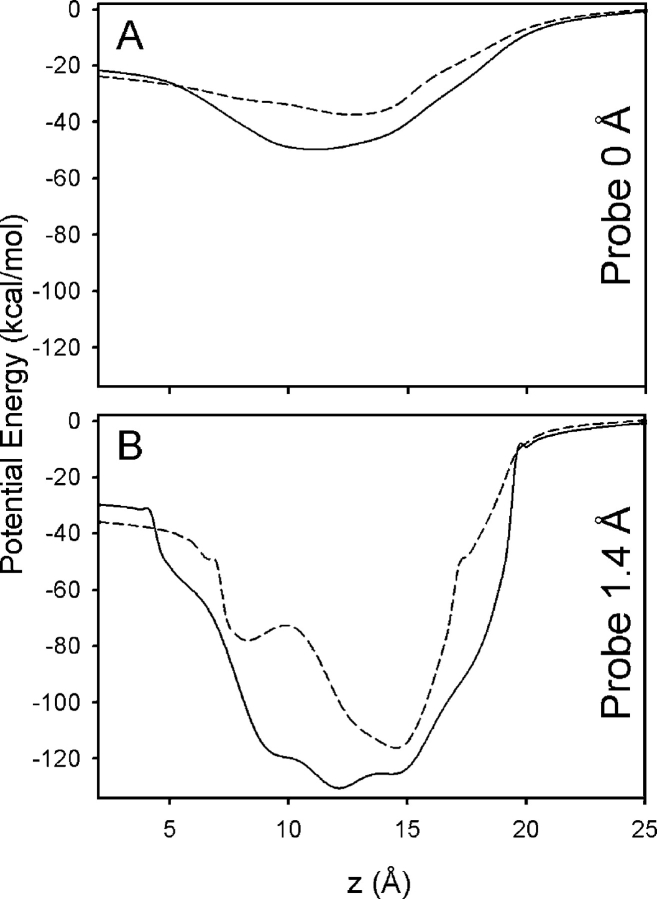
Proteins, including ion channels, often are described in terms of some average structure and pictured as rigid entities immersed in a featureless solvent continuum. This simplified view, which provides for a convenient representation of the protein's overall structure, incurs the risk of deemphasizing important features underlying protein function, such as thermal fluctuations in the atom positions and the discreteness of the solvent molecules. These factors become particularly important in the case of ion movement through narrow pores, where the magnitude of the thermal fluctuations may be comparable to the ion pore atom separations, such that the strength of the ion channel interactions may vary dramatically as a function of the instantaneous configuration of the ion and the surrounding protein and pore water. Descriptions of ion permeation through narrow pores, which employ static protein structures and a macroscopic continuum dielectric solvent, thus face fundamental difficulties. We illustrate this using simple model calculations based on the gramicidin A and KcsA potassium channels, which show that thermal atomic fluctuations lead to energy profiles that vary by tens of kcal/mol. Consequently, within the framework of a rigid pore model, ion-channel energetics is extremely sensitive to the choice of experimental structure and how the space-dependent dielectric constant is assigned. Given these observations, the significance of any description based on a rigid structure appears limited. Creating a conducting channel model from one single structure requires substantial and arbitrary engineering of the model parameters, making it difficult for such approaches to contribute to our understanding of ion permeation at a microscopic level.


Figures

F<sc>igure</sc> 1.
Figure 1.
The displacement of a carbonyl C=O group due to interactions with a K+ ion. The displacement, Δx 0 = x0x 0, following energy minimization, is plotted against the initial separation distance, x 0, between the oxygen atom and the K+ ion. The carbonyl group has a fixed bond length of 1.23 Å and CHARMM PARAM27 (MacKerell et al., 1998) partial charges (q C = 0:51 e, q O = −0:51 e) and Lennard-Jones parameters (depths and positions of minima being: ɛC = 0:11 kcal/mol, ɛO = 0:12 kcal/mol and σC = 4:0 Å, σO = 3:4 Å, respectively). The six curves correspond to three-dimensional RMS fluctuations of 0 (····), 0.1 (− −), 0.2 (− · −), 0.3 (− ·· −), 0.6 (- -) and 1 Å (—), corresponding to spring constants of K = k B T/〈Δr 2〉= ∞, 178, 45, 20, 5, and 0 kcal/mol/Å2, respectively.
F<sc>igure</sc> 2.
Figure 2.
Assigning regions of different dielectric constant with a probe. A simplified example of two carbonyl oxygen atoms (of Born radius 1.52 Å), separated by a distance of 4.64 Å (center to center) such that there is a 1.6 Å gap between the two. A 1.4 Å water probe is rotated around each protein atom. Any volume traced by the probe is assigned a high dielectric constant of ɛ = 80, whereas regions not traced are assigned a low dielectric constant of 2. There is a space between the oxygen atoms where the dielectric constant is low. In much of the gA and KcsA channel pores this is the case (see text for more detail).
F<sc>igure</sc> 3.
Figure 3.
Schematic representation of the model gA system. A two-dimensional drawing of the gA channel (based on the approximate shape and dimensions of the channel), embedded in a continuous membrane and water, is shown cut along a plane containing the z axis. The protein is assigned a dielectric constant of ɛp; it is surrounded by a 25 Å thick membrane of dielectric constant ɛm (representing the hydrophobic core of the bilayer), and by bulk water and channel water with dielectric constant ɛw. The channel water dielectric constant was assigned by underlaying a 6 Å diameter cylinder of length 25 Å beneath the gA channel, but over the membrane slab, meaning that the dielectric constant for any point is assigned with the following priority: bulk water < membrane slab < pore water < protein. A 0.35 Å grid spanning ∼30 Å in the x and y directions, and 70 Å in the z direction, was used.
F<sc>igure</sc> 4.
Figure 4.
(A) Effect of probe radius on the assignment of the dielectric constant along the channel z axis (ɛaxis) for the PDB:1GRM structure. For illustrative purposes, we assign a value of 80 to water and 2 to the protein. (B) The effect of probe size on the potential profile (expressed as potential energy) for the PDB:1GRM structure. Water probe radii of 0.0 (—), 0.8 (·····), 1.0 (- · -), and 1.4 Å (- -) have been used to identify the high and low dielectric regions.
F<sc>igure</sc> 5.
Figure 5.
Energy profiles for reported experimental structures: PDB:1GRM (blue); PDB:1MAG (green); and PDB:1JNO (red). The potential and self energy profiles and their sum are plotted in A, C, and E, respectively, using a water probe radius of 0.0 Å (no probe). B, D, and F show the corresponding results obtained using a probe radius of 1.4 Å. For comparison with the profiles calculated for the static structures, the one-dimensional PMF of Allen et al. (2004) is plotted (—) in E and F.
F<sc>igure</sc> 6.
Figure 6.
RMS fluctuations in residues of the gA channel during 4 ns of MD simulation. The RMS fluctuations in carbonyl oxygen positions are plotted against residue number (residue 0 corresponds to the carbonyl oxygen at the formyl-NH2 terminus).
F<sc>igure</sc> 7.
Figure 7.
The effect of thermal fluctuations on energy profiles. (A) Potential profiles expressed as potential energy) for 194 samples taken from MD simulations using no water probe. (B) The corresponding potential energy profiles obtained using a probe radius of 1.4 Å. C and D show the self energy profiles for 40 samples plotted using probe radii of 0 Å (C) and 1.4 Å (D), respectively.
F<sc>igure</sc> 8.
Figure 8.
Potential energy profiles for the 3.2 Å resolution PDB:1BL8 (- -) and 2.0 Å resolution PDB:1K4C (—) KcsA potassium channel structures. In A, the probe radius was 0.0 Å (no probe) in the Poisson solutions, whereas a probe radius of 1.4 Å was used in B. The axis of fourfold symmetry was aligned with the z axis and the center of the cavity below the selectivity filter placed at the origin.

References

    1. Allen, T.W., and S.-H. Chung. 2001. Brownian dynamics study of an open-state KcsA potassium channel. Biochim. Biophys. Acta. 1515:83–91. - PubMed
    1. Allen, T.W., A. Bliznyuk, A.P. Rendell, S. Kuyucak, and S.-H. Chung. 2000. The potassium channel: structure, selectivity and diffusion. J. Chem. Phys. 112:8191–8204.
    1. Allen, T.W., O.S. Andersen, and B. Roux. 2003. The structure of gramicidin A in a lipid bilayer environment determined using molecular dynamics simulations and solid-state NMR data. J. Am. Chem. Soc. 125:9868–9878. - PubMed
    1. Allen, T.W., O.S. Andersen, and B. Roux. 2004. Energetics of ion conduction through the gramicidin channel. Proc. Natl. Acad. Sci. USA. 101:117–122. - PMC - PubMed
    1. Andersen, O.S., and R.E. Koeppe II. 1992. Molecular determinants of channel function. Physiol. Rev. 72:S89–S158. - PubMed

Publication types