. 2004 Dec 14;101(50):17480-5.
doi: 10.1073/pnas.0407826101. Epub 2004 Nov 30.

Three-dimensional structure and organization of a receptor/signaling complex

Affiliations

Three-dimensional structure and organization of a receptor/signaling complex

Noreen R Francis et al. Proc Natl Acad Sci U S A. .

Abstract

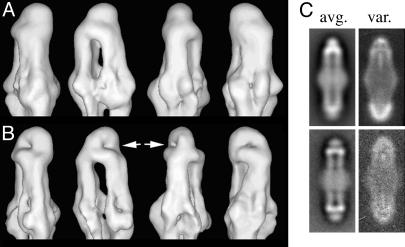
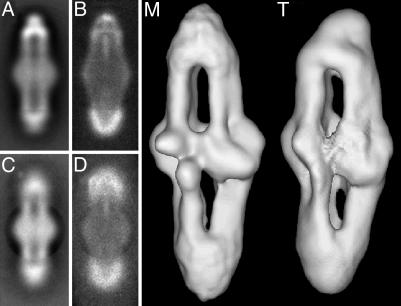
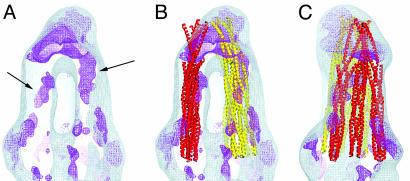
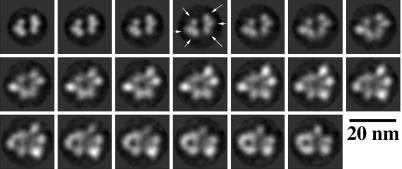
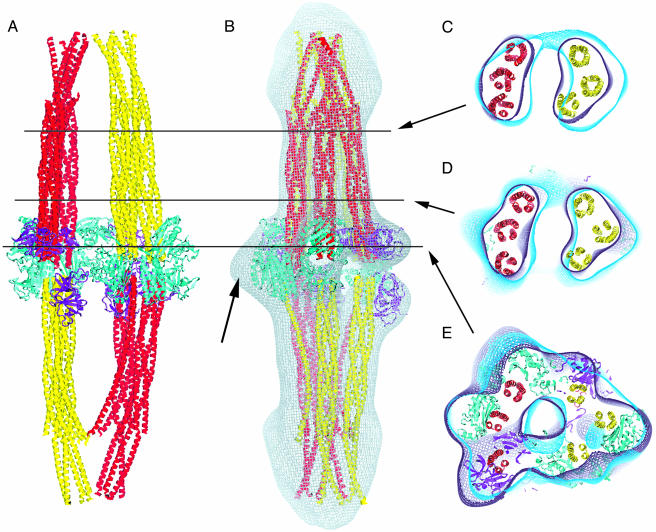
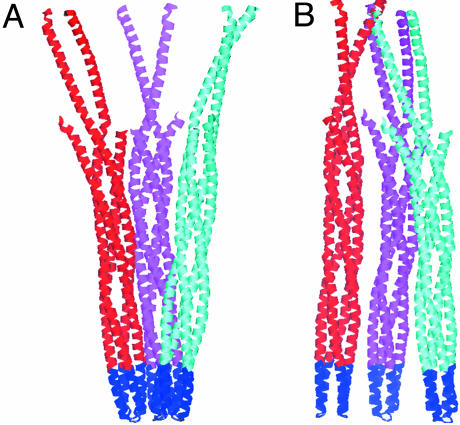
Transmembrane signaling in bacterial chemotaxis has become an important model system for experimental and theoretical studies. These studies have provided a wealth of detailed molecular structures, including the structures of CheA, CheW, and the cytoplasmic domain of the serine receptor Tsr. How these three proteins interact to form the receptor/signaling complex remains unknown. By using EM and single-particle image analysis, we present a three-dimensional reconstruction of the receptor/signaling complex. The complex contains CheA, CheW, and the cytoplasmic portion of the aspartate receptor Tar. We observe density consistent with a structure containing 24 aspartate-receptor monomers and additional density sufficient to house the expected four CheA monomers and six CheW monomers. Within this bipolar structure are four groups of three receptor dimers that are not threefold symmetric and are therefore unlike the symmetric trimers observed in the x-ray crystal structure of the cytoplasmic domain of the serine receptor. In the latter, the interdimer contacts occur in the signaling domains near the hairpin loop. In our structure, the signaling domains within trimers appear spaced apart by the presence of CheA and CheW. This structure argues against models where one CheA and one CheW bind to the outer face of each of the dimers in the trimer. This structure of the receptor/signaling complex provides an additional basis for understanding the architecture of the large arrays of chemotaxis receptors, CheA, and CheW found at the cell poles in motile bacteria.


Figures

Fig. 1.
Fig. 1.
Reconstructions of the receptor/signaling complex. (A) Views of the reconstruction of the TCWA complex. (B) The same views of the T516WA complex. Only the upper portion is shown. The white arrows indicate surface dimples that correlate with C-terminal density that is missing in the T516WA complex. The bulges around the middle correspond to CheW and CheA. (C) The two-dimensional average and variance of the TCWA complex (Upper) and two-dimensional average and variance of the T516WA complex (Lower).
Fig. 2.
Fig. 2.
Comparison of end versus center alignments. Shown are the averages (A and C) and variance maps (B and D) for TCWA. Images in A and B are from alignments to the top two-thirds of the complex, and C and D are from alignments using the middle of the complex. The effect of the circular mask used is clearly seen in C. (M) A surface view of the reconstruction of the TCWA map aligned at the middle. (T) The map aligned by using the top two-thirds. 18-Å and 25-Å filters have been applied to maps M and T, respectively; both maps are contoured using a 1.2-σ cutoff.
Fig. 3.
Fig. 3.
Three-dimensional map of differences between the TCWA and the C-terminally truncated T516WA complexes. (A) A gray wire mesh view of the surface of the reconstruction of the TCWA complex and a darker (magenta) wire mesh representation of density that is missing in the T516WA map (both contoured at 1.2 σ). (B) The same reconstruction with two groups of three TsrC four-helix bundles inserted as arranged in Fig. 5. (C) The same structures after a 90° rotation about the vertical axis. The strongest difference is found within the knob at the end. This difference is not seen in the surface maps (Fig. 1) except as a dimple in the surface of lzTar516 complex. Rods of difference density are seen in A (right arrow), for which there are neighboring negative rods (not shown) consistent with a change in the position of the related four-helix bundle. The other differences are located peripherally and are likely small changes in packing.
Fig. 4.
Fig. 4.
Axial sections through the electron density map of the TCWA complex. The sections, spaced 4.7 Å apart, begin at the top left and are ordered left to right in successive rows. The sections begin just below the knob at the top of the complex in Fig. 2M and end just below the central bulge, ≈two-thirds of the way down the complex. The sections show the presence in each pillar of three blobs of density (arrows) corresponding to the three Tar dimers in each quarter of the complex. The map resolves each of the receptor four-helix bundles at our resolution of 21 Å.
Fig. 5.
Fig. 5.
Modeling of the electron density with the atomic models for TsrC, CheA, and CheW. (A) A view of the complete model without the density map. Shown are CheA (cyan), CheW (magenta), and the TsrC four-helix bundles representing TarC (yellow or red). (B) A view after a rotation of 90° about the long axis. The map in gray is identical to Fig. 2M but a different view. The black arrow indicates unoccupied density that can accommodate the P1 and P2 (data not shown) domains of CheA. (CE) Show are ≈5.0-nm-thick sections through the maps and model. The lines indicate the center of the sections relative to A and B. The maps shown in Fig. 2 M and T are both shown as violet and blue, respectively.
Fig. 6.
Fig. 6.
Comparison of receptor four-helix bundle interactions for TsrC from the x-ray structure with interactions in our model of the receptor/signaling complex. (A) The TsrC trimer of dimers as seen in the x-ray crystal structure (5). Individual four-helix bundles are colored in red, magenta, or cyan. (B) The group of three dimers seen as the yellow cluster in the upper half of Fig. 5A. The signaling domains that interact with CheA and CheW (both at the bottom, in blue) are tightly associated in A, whereas in B they are spread apart, presumably because of their interactions with CheA and CheW.

References

    1. Maddock, J. R. & Shapiro, L. (1993) Science 259, 1717–1723. - PubMed
    1. Gegner, J. A., Graham, D. R., Roth, A. F. & Dahlquist, F. W. (1992) Cell 70, 975–982. - PubMed
    1. Sourjik, V. & Berg, H. C. (2004) Nature 428, 437–441. - PubMed
    1. Duke, T. A. & Bray, D. (1999) Proc. Natl. Acad. Sci. USA 96, 10104–10108. - PMC - PubMed
    1. Kim, K. K., Yokota, H. & Kim, S. H. (1999) Nature 400, 787–792. - PubMed

Publication types

MeSH terms

LinkOut - more resources