. 2004 Dec 1;24(48):10816-25.
doi: 10.1523/JNEUROSCI.2931-04.2004.

The mental retardation protein PAK3 contributes to synapse formation and plasticity in hippocampus

Affiliations

The mental retardation protein PAK3 contributes to synapse formation and plasticity in hippocampus

Bernadett Boda et al. J Neurosci. .

Abstract

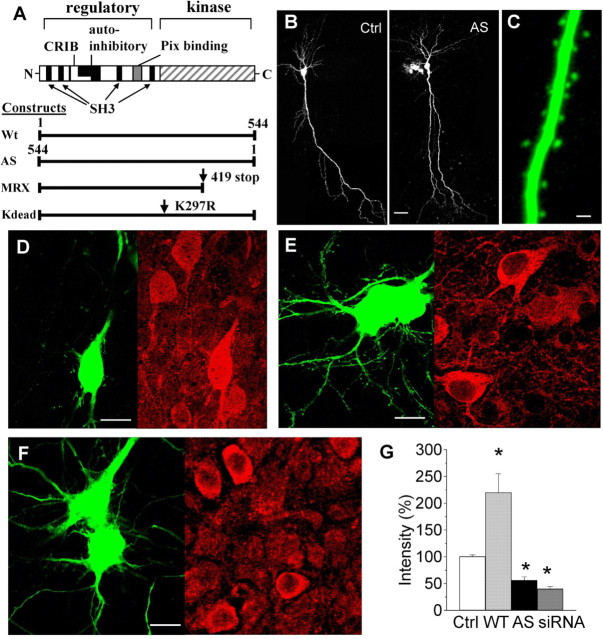
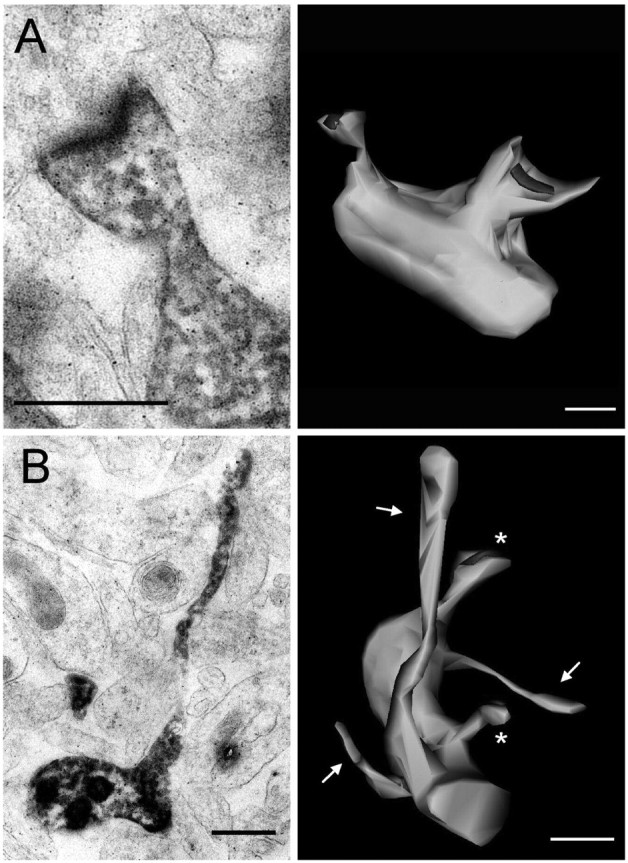
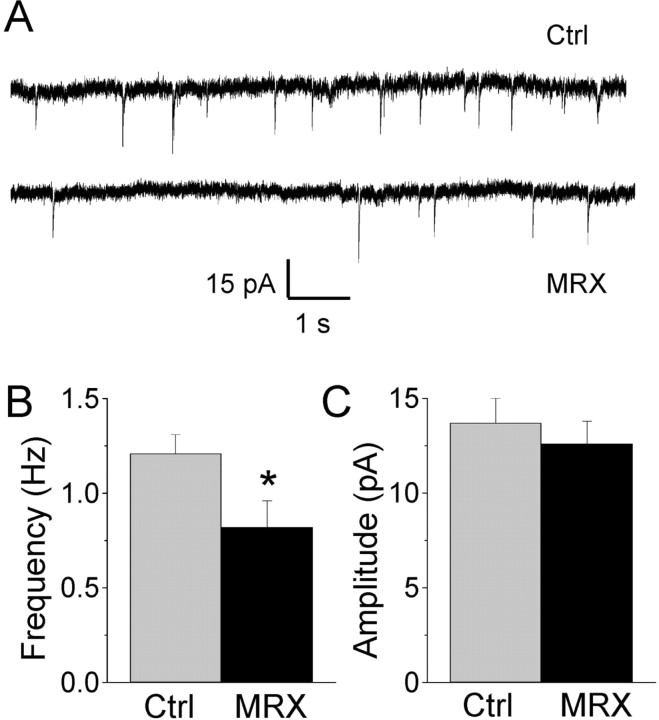
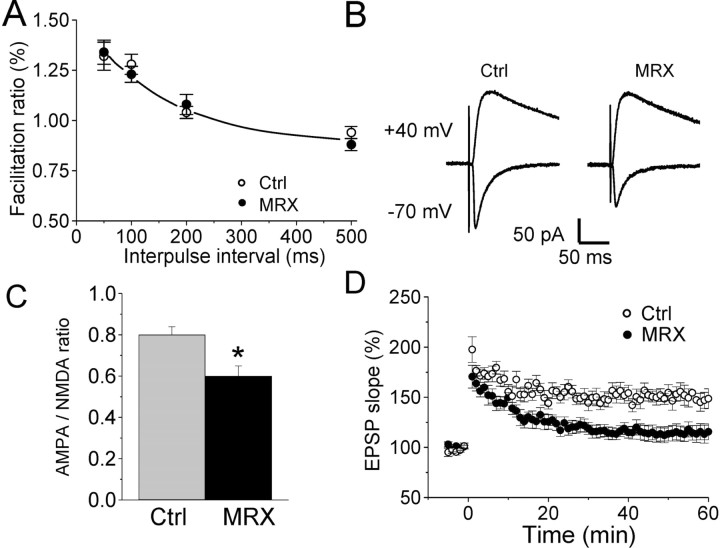
Mutations of the gene coding for PAK3 (p21-activated kinase 3) are associated with X-linked, nonsyndromic forms of mental retardation (MRX) in which the only distinctive clinical feature is the cognitive deficit. The mechanisms through which PAK3 mutation produces the mental handicap remain unclear, although an involvement in the mechanisms that regulate the formation or plasticity of synaptic networks has been proposed. Here we show, using a transient transfection approach, that antisense and small interfering RNA-mediated suppression of PAK3 or expression of a dominant-negative PAK3 carrying the human MRX30 mutation in rat hippocampal organotypic slice cultures results in the formation of abnormally elongated dendritic spines and filopodia-like protrusions and a decrease in mature spine synapses. Ultrastructural analysis of the changes induced by expression of PAK3 carrying the MRX30 mutation reveals that many elongated spines fail to express postsynaptic densities or contact presynaptic terminals. These defects are associated with a reduced spontaneous activity, altered expression of AMPA-type glutamate receptors, and defective long-term potentiation. Together, these data identify PAK3 as a key regulator of synapse formation and plasticity in the hippocampus and support interpretations that these defects might contribute to the cognitive deficits underlying this form of mental retardation.


Figures

Figure 1.
Figure 1.
Modulation of PAK3 expression by transfection in hippocampal slice cultures. A, Organization of PAK3 protein and structure of PAK3 constructs inserted in a pcDNA3.1 vector under the control of a cytomegalovirus promoter. MRX30 and Kdead mutations resulted in a nonfunctional kinase domain. AS, Antisense; CRIB, Cdc42/Rac-interactive binding site; Ctrl, control. B, Illustration of pyramidal cells transfected with EGFP and PAK3 antisense constructs. Scale bar, 20 μm. C, Expression of an EGFP-PAK3 fusion protein in CA1 cells reveals a diffuse localization of PAK3 in dendrites and dendritic spines. Scale bar, 2 μm. D, Cotransfection of a pyramidal cell with EGFP and wild-type PAK3 (left) and revealed using a specific anti-PAK3 antibody (right). Note the increased immunostaining in the transfected cell compared with other cells in the same focal plane. Scale bar, 20 μm. E, Cotransfection with EGFP and PAK3 antisense (left) analyzed using anti-PAK3 immunostaining (right). Note the reduced level of immunostaining in the antisense-transfected cell. Scale bar, 20 μm. F, Reduced expression of PAK3 in two cells cotransfected with EGFP and PAK3 siRNA oligos (left) and analyzed using anti-PAK3 immunostaining (right). Scale bar, 20 μm. G, Quantitative analysis of the level of anti-PAK3 immunostaining measured under the indicated conditions in 10-13 different cells obtained from four to six different slice cultures. *p < 0.05.
Figure 2.
Figure 2.
Specific alteration of PAK3 expression by PAK3 siRNA transfection. A, Level of expression of PAK1, PAK2, and PAK3 mRNA in neuroblastoma cells transfected with either EGFP or EGFP and a PAK3 siRNA oligo (n = 3; *p < 0.05). B, C, Immunostaining analysis of PAK1 and PAK2 expression in pyramidal cells transfected with an EGFP-PAK3 siRNA construct. The left panels illustrate the EGFP-transfected cells, and the right panels show the levels of PAK1 (B) and PAK2 (C) immunoreactivity in the same cells. Quantitative analyses of immunostaining levels (expressed as percentage of the control levels obtained in neighboring cells) show no modifications in PAK3 siRNA-transfected neurons (ratio of 96 ± 6% for PAK1, n = 12; 106 ± 3% for PAK2, n = 9). Scale bars, 20 μm.
Figure 3.
Figure 3.
Changes in spine morphology induced by antisense or siRNA downregulation of PAK3 expression. A, Illustration of the spine morphology obtained from cells cotransfected with EGFP and an empty vector (Ctrl), a control, nonsense siRNA oligo (siCtrl), wild-type PAK3 (WT), PAK3 siRNA oligo (siRNA), or PAK3 antisense (AS). Scale bars. 2 μm. Note the numerous elongated spines (arrows) and filopodia-like protrusions (asterisks) present in siRNA- and antisense-transfected cells. B, Changes in the proportion of regular spines (<2 μm in length), corresponding mainly to stubby and mushroom-type spines, observed under the indicated conditions. Data are mean ± SEM of measurements obtained from 7-11 experiments (260-891 protrusions analyzed). *p < 0.05. C, Changes in the proportion of filopodia observed in the same group of experiments). *p < 0.05. D, Changes in the proportion of elongated spines (>2 μm in length) observed in the same group of experiments. *p < 0.05.
Figure 4.
Figure 4.
Changes in spine morphology produced by expression of dominant-negative PAK3 constructs carrying the human MRX30 mutation or Kdead mutation. A, Illustration of the spine morphology observed in cells cotransfected with EGFP and an empty vector (Ctrl), PAK3 MRX30 gene (MRX), or PAK3 carrying the Kdead mutation (Kdead). Arrows point to elongated spines, and asterisks indicate filopodia-like protrusions. Scale bars, 2 μm. B, Changes in the proportion of regular spines (<2 μm in length), observed under the indicated conditions. Data are mean ± SEM of measurements obtained from seven experiments per condition (244-344 protrusions analyzed). *p < 0.05. C, Changes in the proportion of filopodia observed in the same group of experiments. *p < 0.05. D, Changes in the proportion of elongated spines (>2 μm in length) observed in the same group of experiments. *p < 0.05. E, Cumulative plots of the distribution of spine lengths observed under the indicated conditions. Note the shift to the right observed in conditions of reduced PAK3 expression or expression of dominant-negative PAK3 (black symbols).
Figure 5.
Figure 5.
3D reconstruction of spines and filopodia-like protrusions of EGFP- and MRX30-transfected cells. A, Left, Single-section electron micrograph of a dendritic spine and its PSD obtained after photoconversion of a control, EGFP-transfected cell. Right, 3D reconstruction of a dendritic segment with two spine synapses. B, Left, Single-section electron micrographs of a filopodia-like protrusion devoid of PSD and presynaptic partner and obtained by photoconversion of an MRX30-transfected neuron. Right, 3D reconstruction of a dendritic segment obtained from an MRX30-transfected neuron showing two small spine synapses (asterisks) and three unconnected filopodia-like protrusions lacking PSDs (arrows). Scale bars, 0.5 μm.
Figure 6.
Figure 6.
Morphological characteristics of elongated spine protrusions observed in MRX30-transfected cells. A, Single-section electron micrograph (left) and 3D reconstruction (right) of a thin, elongated spine protrusion devoid of PSD and synaptic contact and obtained by photoconversion of an MRX30-transfected neuron. B, Single-section electron micrograph (left) and 3D reconstruction (right) of a thin, elongated spine protrusion exhibiting a very small head and small PSD, obtained by photoconversion of an MRX30-transfected neuron. Scale bar, 0.5 μm. C, Proportion of unconnected dendritic protrusions devoid of PSDs or presynaptic partner (black columns) and proportion of mature spine synapses (gray columns) in control (Ctrl) and PAK3 MRX30-transfected neurons (n = 3-7; 83-190 protrusions analyzed). *p < 0.01. D, PSD length of spine synapses measured on single sections in control (gray column) and PAK3 MRX30-transfected (black column) neurons (n = 3-7; 42-86 PSDs analyzed). *p < 0.05.
Figure 7.
Figure 7.
PAK3 MRX30-transfected cells show reduced spontaneous miniature activity. A, Illustration of spontaneous miniature EPSCs recorded in control and PAK3 MRX30-transfected CA1 neurons. B, Mean frequency of miniature EPSCs recorded in six control (Ctrl) and six PAK3 MRX30-transfected neurons. *p < 0.05. C, The mean amplitude of spontaneous miniature EPSCs does not significantly differ in control and PAK3 MRX30-transfected cells (n = 6).
Figure 8.
Figure 8.
PAK3 MRX30 mutation is associated with altered postsynaptic properties and defects in synaptic plasticity. A, Paired-pulse facilitation does not differ between control (Ctrl) and PAK3 MRX30-transfected cells (n = 6). B, Illustration of AMPA and NMDA EPSCs evoked by the same stimulation pulses in control and PAK3 MRX30-transfected cells. C, Quantitative assessment of AMPA/NMDA ratio measured in six control (gray column) and six PAK3 MRX30-transfected (black column) neurons. *p < 0.05. D, PAK3 MRX30-transfected cells show alterations of synaptic plasticity. Changes in EPSP slope induced by a pairing protocol in five control and seven PAK3 MRX30-transfected neurons. Data are mean ± SEM. Differences are statistically significant (p < 0.01).

References

    1. Allen KM, Gleeson JG, Bagrodia S, Partington MW, MacMillan JC, Cerione RA, Mulley JC, Walsh CA (1998) PAK3 mutation in nonsyndromic X-linked mental retardation. Nat Genet 20: 25-30. - PubMed
    1. Bagrodia S, Taylor SJ, Creasy CL, Chernoff J, Cerione RA (1995) Identification of a mouse p21Cdc42/Rac activated kinase. J Biol Chem 270: 22731-22737. - PubMed
    1. Bienvenu T, des Portes V, McDonell N, Carrie A, Zemni R, Couvert P, Ropers HH, Moraine C, van Bokhoven H, Fryns JP, Allen K, Walsh CA, Boue J, Kahn A, Chelly J, Beldjord C (2000) Missense mutation in PAK3, R67C, causes X-linked nonspecific mental retardation. Am J Med Genet 93: 294-298. - PubMed
    1. Bokoch GM (2003) Biology of the p21-activated kinases. Annu Rev Biochem 72: 743-781. - PubMed
    1. Chelly J, Mandel JL (2001) Monogenic causes of X-linked mental retardation. Nat Rev Genet 2: 669-680. - PubMed

Publication types

MeSH terms