

pH effects on the stability and dimerization of procaspase-3
- PMID: 15576551
- PMCID: PMC2253328
- DOI: 10.1110/ps.041003305
pH effects on the stability and dimerization of procaspase-3
Abstract
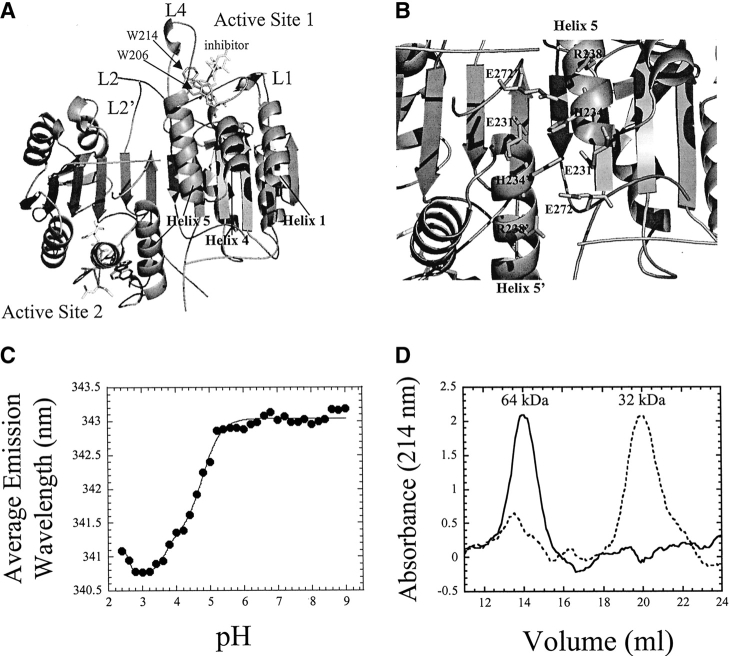
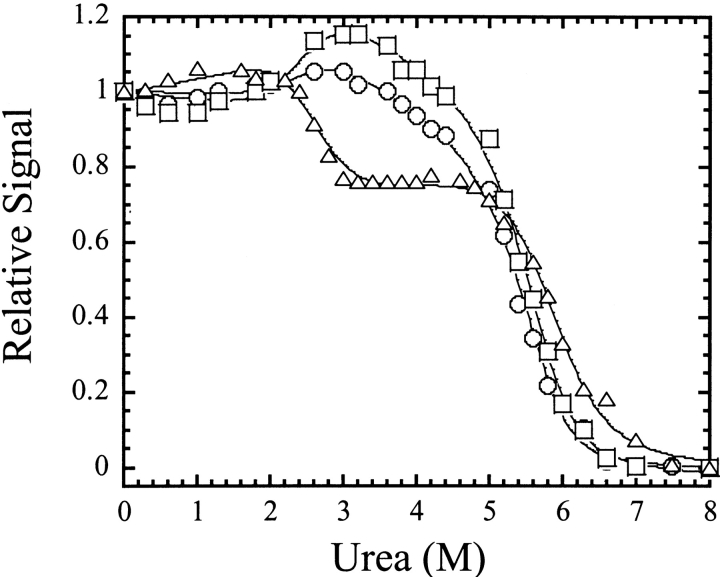
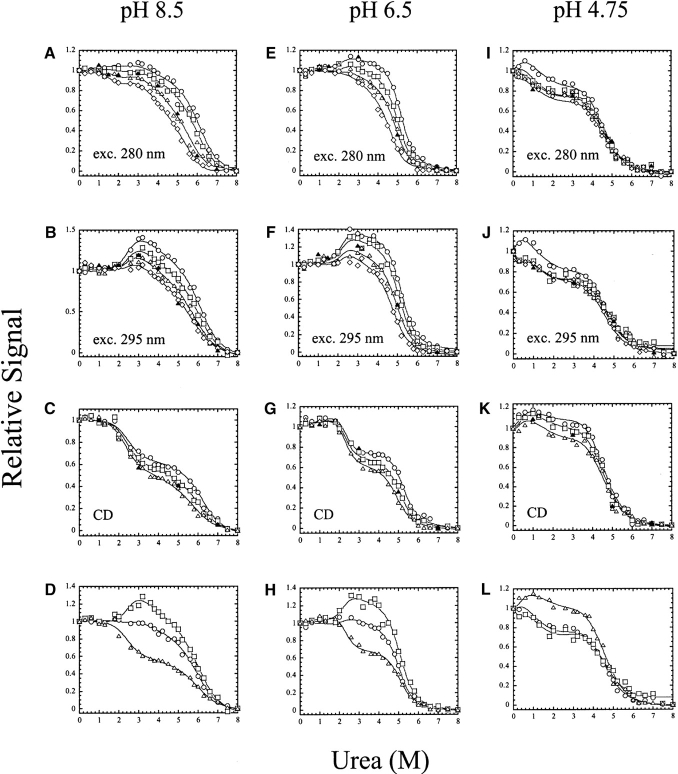
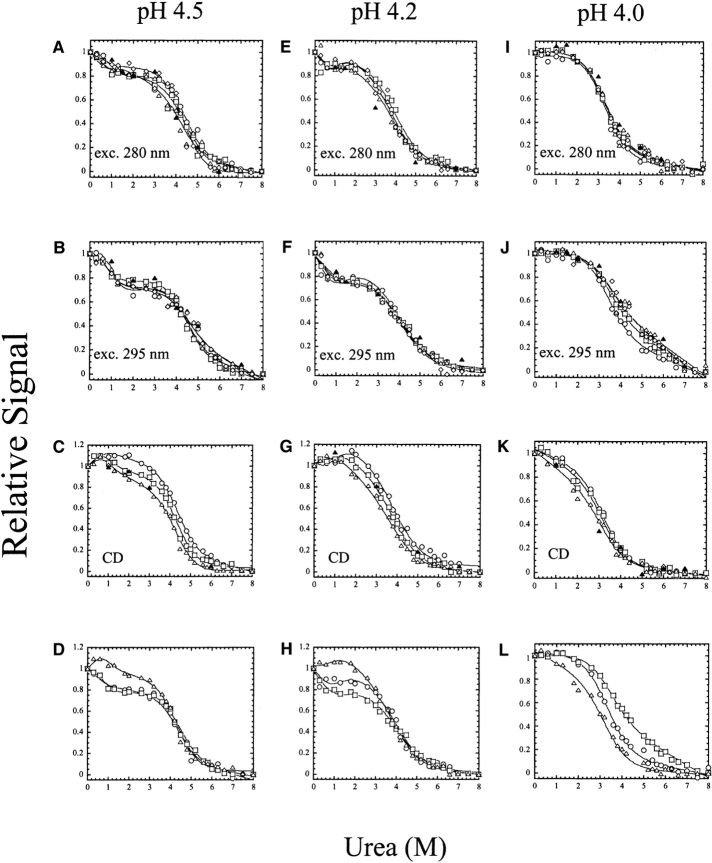
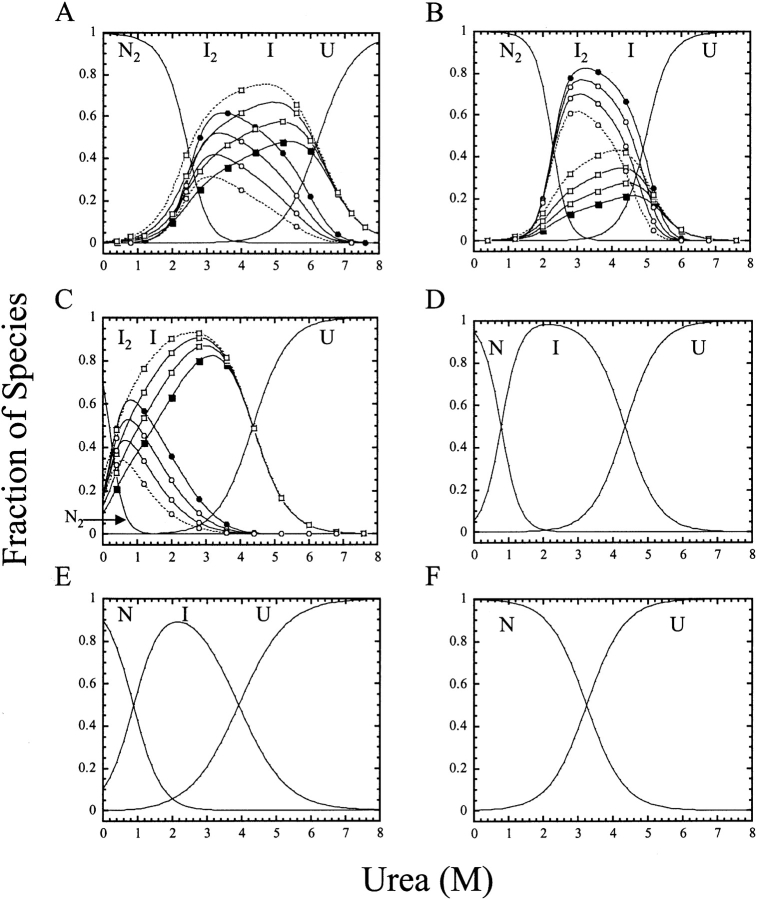
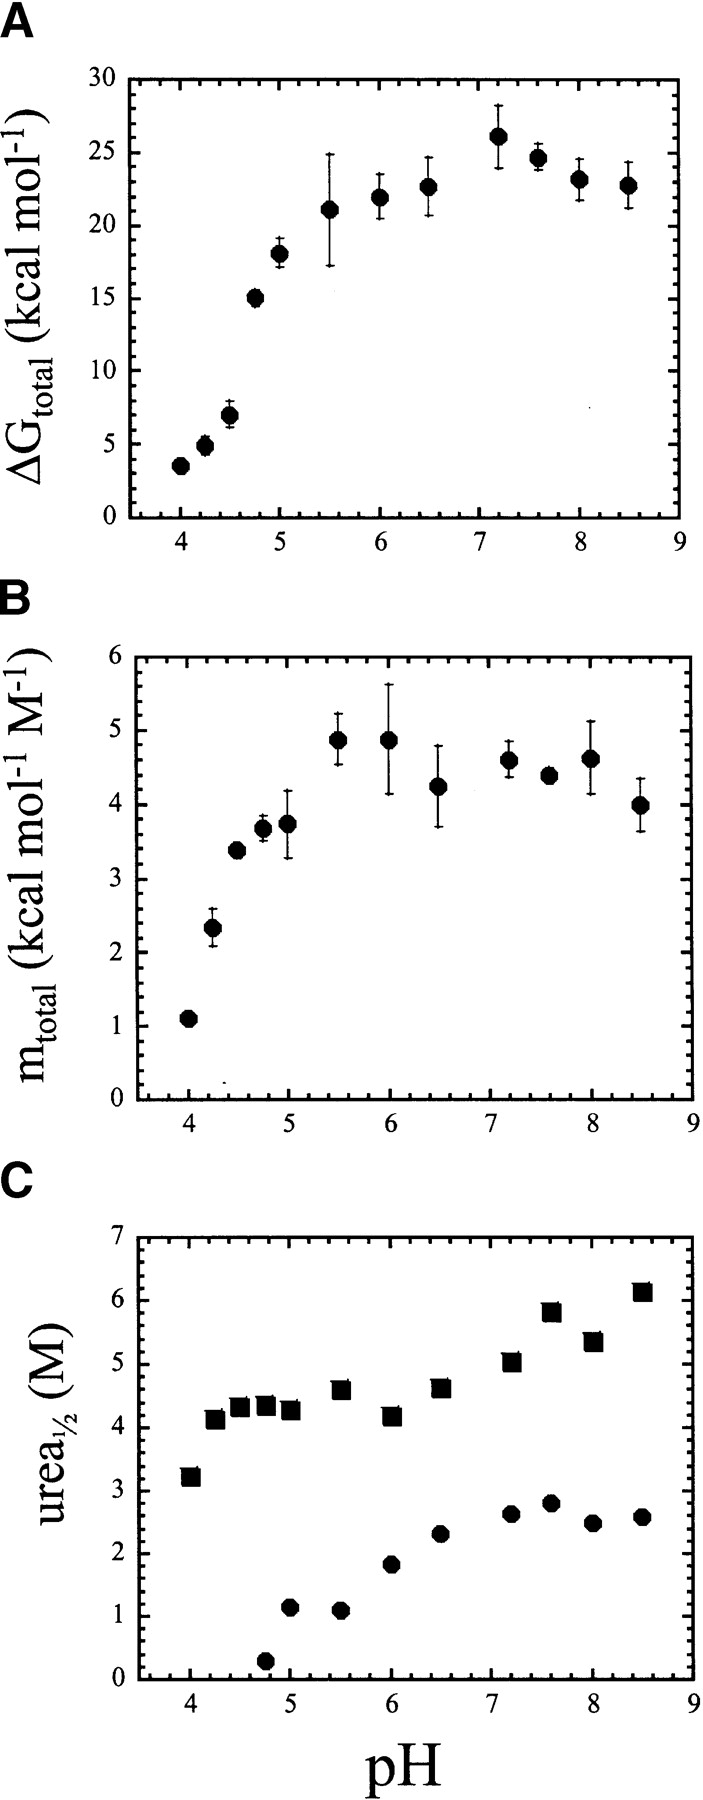
pH-dependent conformational changes are known to occur in dimeric procaspase-3, and they have been shown to affect the rate of automaturation. We studied the equilibrium unfolding of procaspase-3(C163S) as a function of pH (between pH 8.5 and pH 4) in order to examine these changes in the context of folding and stability. The data show that the procaspase dimer undergoes a pH-dependent dissociation below pH 5, so that the protein is mostly monomeric at pH 4. Consistent with this, the dimer unfolds via a four-state process between pH 8.5 and pH 4.75, in which the native dimer isomerizes to a dimeric intermediate, and the dimeric intermediate dissociates to a monomer, which then unfolds. In contrast, a small protein concentration dependence was observed by circular dichroism, but not by fluorescence emission, at pH 4.5 and pH 4.2. There was no protein-concentration dependence to the data collected at pH 4. Overall, the results are consistent with the redistribution of the population of native dimer (N(2)) to dimeric intermediate (I(2)) to monomeric intermediate (I), as the pH is lowered so that at pH 4, the "native" ensemble resembles the monomeric intermediate (I) observed during unfolding at higher pH. An emerging picture of the monomeric procaspase is discussed. Procaspase-3 is most stable at pH approximately 7 (24-26 kcal/mol), and while the stability decreased with pH, it was observed that dimerization contributes the majority (>70%) of the conformational free energy.
Figures
Similar articles
-
Dimeric procaspase-3 unfolds via a four-state equilibrium process.Biochemistry. 2001 Nov 27;40(47):14236-42. doi: 10.1021/bi0110387. Biochemistry. 2001. PMID: 11714277
-
Comparing the folding landscapes of evolutionarily divergent procaspase-3.Biosci Rep. 2022 Jun 30;42(6):BSR20220119. doi: 10.1042/BSR20220119. Biosci Rep. 2022. PMID: 35670809 Free PMC article.
-
Folding and assembly kinetics of procaspase-3.Protein Sci. 2009 Dec;18(12):2500-17. doi: 10.1002/pro.259. Protein Sci. 2009. PMID: 19798740 Free PMC article.
-
Slow folding and assembly of a procaspase-3 interface variant.Biochemistry. 2013 May 21;52(20):3415-27. doi: 10.1021/bi400115n. Epub 2013 May 7. Biochemistry. 2013. PMID: 23614869
-
Dissociative thermal inactivation, stability, and activity of oligomeric enzymes.Biochemistry (Mosc). 1998 Mar;63(3):303-11. Biochemistry (Mosc). 1998. PMID: 9526127 Review.
Cited by
-
Sequential Unfolding Mechanisms of Monomeric Caspases.Biochemistry. 2023 Jun 20;62(12):1878-1889. doi: 10.1021/acs.biochem.3c00004. Epub 2023 May 31. Biochemistry. 2023. PMID: 37337671 Free PMC article.
-
Sequential unfolding mechanisms of monomeric caspases.bioRxiv [Preprint]. 2023 Jan 4:2023.01.04.522771. doi: 10.1101/2023.01.04.522771. bioRxiv. 2023. Update in: Biochemistry. 2023 Jun 20;62(12):1878-1889. doi: 10.1021/acs.biochem.3c00004. PMID: 36711547 Free PMC article. Updated. Preprint.
-
Melody, an ENU mutation in Caspase 3, alters the catalytic cysteine residue and causes sensorineural hearing loss in mice.Mamm Genome. 2010 Dec;21(11-12):565-76. doi: 10.1007/s00335-010-9306-2. Epub 2010 Nov 30. Mamm Genome. 2010. PMID: 21116635 Free PMC article.
-
Thermodynamic, enzymatic and structural effects of removing a salt bridge at the base of loop 4 in (pro)caspase-3.Arch Biochem Biophys. 2011 Apr 1;508(1):31-8. doi: 10.1016/j.abb.2011.01.011. Epub 2011 Jan 23. Arch Biochem Biophys. 2011. PMID: 21266160 Free PMC article.
-
Oligomerization endows enormous stability to soybean agglutinin: a comparison of the stability of monomer and tetramer of soybean agglutinin.Biophys J. 2005 Jun;88(6):4243-51. doi: 10.1529/biophysj.105.061309. Epub 2005 Mar 25. Biophys J. 2005. PMID: 15792973 Free PMC article.
References
-
- Barrick, D. and Baldwin, R.L. 1993. Three-state analysis of sperm whale apomyoglobin folding. Biochemistry 32 3790–3796. - PubMed
-
- Boatright, K.M., Renatus, M., Scott, F.L., Sperandio, S., Shin, H., Pedersen, I.M., Ricci, J.-E., Edris, W.A., Sutherlin, D.P., Green, D.R., et al. 2003. A unified model for apical caspase activation. Mol. Cell 11 529–541. - PubMed
-
- Bose, K. and Clark, A.C. 2001. Dimeric procaspase-3 unfolds via a four-state equilibrium process. Biochemistry 40 14236–14242. - PubMed
-
- Brown, C.R., Hong-Brown, L.Q., and Welch, W.J. 1997. Strategies for correcting the ΔF508 CFTR protein-folding defect. J. Bioener. Biomem. 29 491–502. - PubMed
Publication types
MeSH terms
Substances
Grants and funding
LinkOut - more resources
Full Text Sources
Research Materials
