. 2005 Jan;14(1):183-92.
doi: 10.1110/ps.04973805. Epub 2004 Dec 2.

Computational analysis of the transient movement of helices in sensory rhodopsin II

Affiliations

Computational analysis of the transient movement of helices in sensory rhodopsin II

Y Sato et al. Protein Sci. 2005 Jan.

Abstract

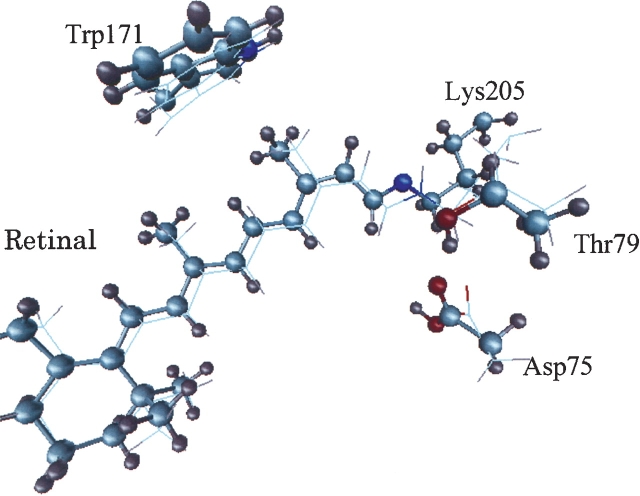
MD simulation of sensory rhodopsin II was executed for three intermediates (ground-state, K-state, M-state) appearing in its photocycle. We observed a large displacement of the cytoplasmic side of helixF only in M-state among the three intermediates. This displacement was transmitted to TM2, and the cytoplasmic side of TM2 rotated clockwise. These transient movements are in agreement with the results of an EPR experiment. That is, the early stage of signal transduction in a sRII-HtrII complex was successfully reproduced by the in silico MD simulation. By analyzing the structure of the sRII-HtrII complex, the following findings about the photocycle of sRII were obtained: (1) The hydrogen bonds between helixF and other helices determine the direction of the movement of helixF; (2) three amino acids (Arg162, Thr189, Tyr199) are essential for sRII-HtrII binding and contribute to the motion transfer from sRII to HtrII; (3) after the isomerization of retinal, a major conformational change of retinal was caused by proton transfer from Schiff base to Asp75, which, in turn, triggers the steric collision of retinal with Trp171. This is the main reason for the movement of the cytoplasmic side of helixF.


Figures

Figure 1.
Figure 1.
Simulation model for sRII–HtrII–lipid layer–solvent water system. (A) sRII–HtrII complex manually inserted into the cavity of lipid bilayer. (B) Structure of a component of the lipid bilayer:PGP-Me. PGP-Me is the main component of purple membrane (PM). (C) The model containing the water molecules at the top and bottom sides of the lipid–protein complex. (D) The lipid–protein complex viewed from the cytoplasmic side. Waters are not shown for the sake of visual clarity.
Figure 2.
Figure 2.
The fluctuation of the thickness of lipid bilayer (the average distance between the hydroxyl group’s oxygen atoms of glycerol) during the equilibrating and the subsequent dynamics simulations in the ground-state. Dashed line shows the value of the thickness obtained by the electron diffraction experiment in Halobacterium salinarium (Mitsuoka et al. 1999).
Figure 3.
Figure 3.
Distance between Schiff base and two amino acid residues as a function of simulation time in three intermediates. (A) The distance between Schiff base and oxygen atom of the hydroxyl side chain of Thr79. (B) The distance between Schiff base and the oxygen atom of the calboxyl side chain of Asp201.
Figure 4.
Figure 4.
Sketch of the hydrogen bond network between helixF and other helices of sRII viewed from the cytoplasmic side. The thick arrow is the direction of the movement of helixF proposed by EPR experiments (Wegener et al. 2000).
Figure 5.
Figure 5.
Distance between the center of sRII (residues 1–225) and the center of cytoplasmic half side (residues 158–170) in the course of the simulation.
Figure 6.
Figure 6.
Superimposed structure of M-state and the ground-state. Each structure is the average of the last 50 psec of the simulation. A green ball represents the center of whole protein, and the red and blue balls represent the center of the cytoplasmic side (residues 158–170) of helixF. Arrow shows the direction of movement of helixF in M-state.
Figure 7.
Figure 7.
(A) van der Waals interaction energy between retinal and each residue of sRII. (B) Degree of sequence conservation among 16 bacterial retinal–proteins (bR, hR, sRI, sRII). First, we aligned the amino acid sequence of the 16 retinal proteins, then determined the degree of amino acid sequence conservation of Natronobacterium pharaonis sRII. The degree is calculated from the following equation: degree = (the number of proteins in which sRII sequence is conserved at the corresponding position/total number of bacterial retinal proteins). (C) Difference of van der Waals interaction energy between M-state and the ground-state. The negative value means that the interaction becomes weaker in M-state than the ground-state.
Figure 8.
Figure 8.
Superimposition of atom geometry between M-state and K-state. Each geometry was obtained from the average structure during the last 50 psec of the MD simulation. M-state is represented by a ball-and-stick, and K-state structure is represented by a thin stick.
Figure 9.
Figure 9.
(A) Conformational changes of cytoplasmic side of TM2 in the course of a 2-nsec MD simulation, viewed from the cytoplasmic side. Each structure was superimposed on the initial structure of M-state MD simulation. Red balls represent Cα carbon atoms of the three amino acid residues (Ala79, Ala80, Thr81) of TM2 in the initial structure. Blue balls represent those in the snapshot structure at each simulation time. Rotational angle of each amino acid residue from the initial structure is shown below the snapshot structure at the respective simulation time. (B) Side-chain locations of these three amino acid residues. The initial structure is represented by sticks and the snapshot structure at 1800 psec by a ball and stick. 1, 2, and 3 represent the displacement of methyl carbon atoms in the 1800-psec snapshot structure measured from the initial structure. Black arrow represents the direction of each amino acid residue’s movement, and red arrow represents the rotational direction of TM2.
Figure 10.
Figure 10.
(A) van der Waals(VDW) and Coulomb(EEL) interaction energy between HtrII and each amino acid residue of helixF and helixG (sRII). The residues marked with a circle had the large interaction with HtrII. (B) van der Waals (VDW), Coulomb(EEL), and solvation (SOL) interaction energy between HtrII and each amino acid residue of helixF and helixG (sRII).

References

    1. Altschul, S.F., Stephen, F., Madden, T.L., Schaffer, A.A., Zhang, J., Zhang, Z., Miller, W., and Lipman, D.J. 1997. Gapped BLAST and PSI-BLAST: A new generation of protein database search programs. Nucleic Acids Res. 25 3389–3402. - PMC - PubMed
    1. Becke, A.D. 1993. Density-functional thermochemistry. III. The role of exact exchange. J. Chem. Phys. 98 5648–5652.
    1. Case, D.A., Pearlman, D.A., Caldwell, J.W., Cheatham III, T.E., Wang, J., Ross, W.S., Simmerling, C.L., Darden, T.A., Merz, K.M., Standon, R.V., et al. 2002. AMBER7. University of California, San Francisco, CA.
    1. Cieplak, P., Cornell, W.D., Bayly, C., and Kollman, P.A. 1995. Application to the multimolecule and multiconformational RESP methodology to biopolymers: Charge derivation for DNA, RNA and proteins. J. Computat. Chem. 16 1357–1377.
    1. Edman, K., Royant, A., Nollert, P., Maxwell, C.A., Pebay-Peyroula, E., Navarro, J., Neutze, R., and Landau, E.M. 2002. Early structural rearrengements in the photocycle of an integral membrane sensory receptor. Structure 10 473–482. - PubMed

Publication types

Substances

LinkOut - more resources