. 2004 Dec;186(24):8407-23.
doi: 10.1128/JB.186.24.8407-8423.2004.

Effect of mild acid on gene expression in Staphylococcus aureus

Affiliations

Effect of mild acid on gene expression in Staphylococcus aureus

Brian Weinrick et al. J Bacteriol. 2004 Dec.

Abstract

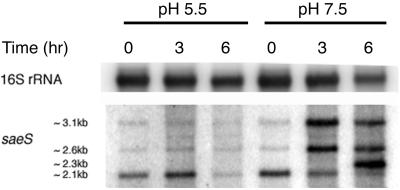
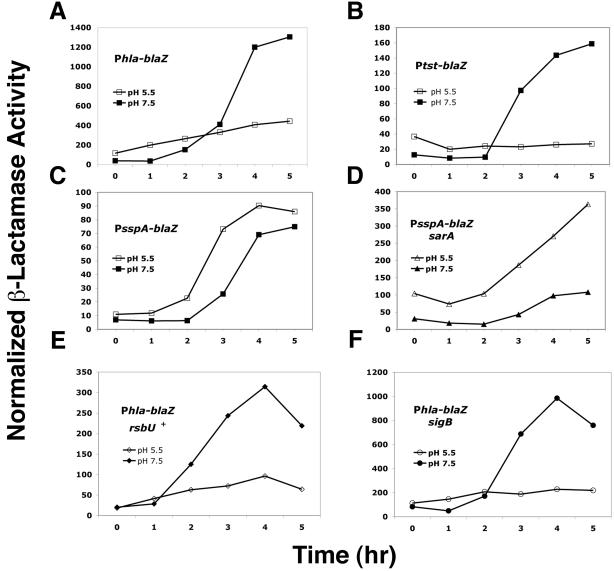
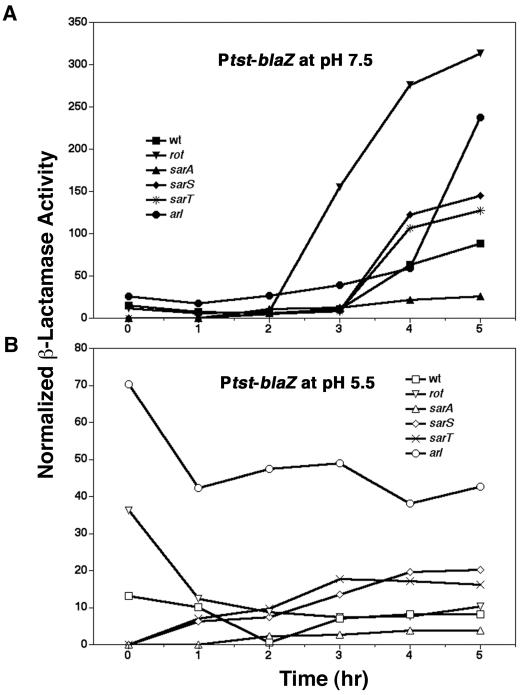
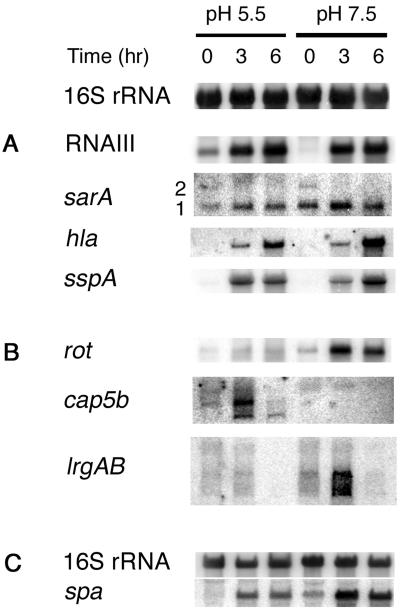
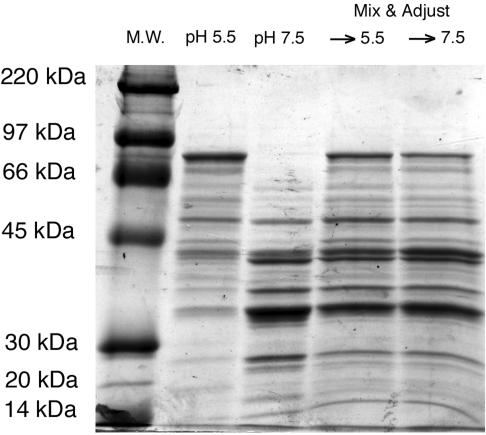
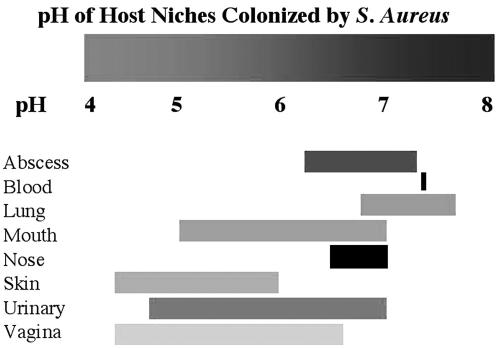
During staphylococcal growth in glucose-supplemented medium, the pH of a culture starting near neutrality typically decreases by about 2 units due to the fermentation of glucose. Many species can comfortably tolerate the resulting mildly acidic conditions (pH, approximately 5.5) by mounting a cellular response, which serves to defend the intracellular pH and, in principle, to modify gene expression for optimal performance in a mildly acidic infection site. In this report, we show that changes in staphylococcal gene expression formerly thought to represent a glucose effect are largely the result of declining pH. We examine the cellular response to mild acid by microarray analysis and define the affected gene set as the mild acid stimulon. Many of the genes encoding extracellular virulence factors are affected, as are genes involved in regulation of virulence factor gene expression, transport of sugars and peptides, intermediary metabolism, and pH homeostasis. Key results are verified by gene fusion and Northern blot hybridization analyses. The results point to, but do not define, possible regulatory pathways by which the organism senses and responds to a pH stimulus.


Figures

FIG. 1.
FIG. 1.
Northern blot analysis of the effect of pH on saeS transcripts. Whole-cell RNA was extracted from RN6734 grown in CYGP broth without glucose and adjusted to pH 5.5 or 7.5. The RNA was separated on a denaturing gel and vacuum blotted; the blot was hybridized with a radiolabeled DNA probe complementary to saeS. The probe was detected with a PhosphorImager. Equalization was determined by subsequent blotting with a probe complementary to 16S rRNA.
FIG. 2.
FIG. 2.
Transcriptional reporter analysis of the effect of pH on transcription of genes coding for several exoproteins, the effect of sarA on pH-dependent sspA transcription, and the effect of rsbU and sigB on pH-dependent hla transcription. RN6734 transduced with pRN7044 (Ptst::blaZ) (A), pRN6827 (Phla::blaZ) (B), or pRN7041 (PsspA::blaZ) (C) was assayed for β-lactamase activity during growth at pH 5.5 or pH 7.5. (D) pH-dependent β-lactamase activity of RN9388 (RN6734 ΔsarA) transduced with pRN7041, measured during growth. (E) pH-dependent β-lactamase activity of RN10029 (RN6734 rsbU+) transduced with pRN6827, measured during growth. (F) pH-dependent β-lactamase activity of RN9898 (RN6734 ΔsigB) transduced with pRN6827, measured during growth.
FIG. 3.
FIG. 3.
Transcriptional reporter analysis of the effect of pH on the transcription of genes coding for Tsst at pH 7.5 (A) and pH 5.5 (B) in various genetic backgrounds. In Emr-marked mutants, Ptst::blaZ reporter pRN7166 was used.
FIG. 4.
FIG. 4.
Northern blot analysis of the effect of pH on the transcript levels of genes coding for several exoproteins and their regulators. (A and B) Blots of whole-cell RNA from RN6734 grown in CYGP broth without glucose and adjusted to pH 5.5 or 7.5. (B) Blots of transcripts identified by microarray analysis as pH dependent. The 16S rRNA blot above panels A and B shows equal loading. (C) pH-dependent expression of spa in RN7206 (RN6734 Δagr); equal loading is shown by the adjacent 16S rRNA blot.
FIG. 5.
FIG. 5.
Exoprotein profiles of cultures grown at pH 5.5 or 7.5, and the effect of pH-dependent protease activity on exoprotein profiles. Exoprotein was prepared from 6-h cultures grown in CYGP broth adjusted to either pH 5.5 or pH 7.5. Supernatants from equal numbers of cells were precipitated with trichloroacetic acid and subjected to SDS-PAGE. The right two lanes show exoprotein from both of the left lanes combined, adjusted to each pH, and incubated at 37°C for 30 min to investigate the effect of differential protease activity.
FIG. 6.
FIG. 6.
pH ranges of various niches S. aureus can colonize in the human host. Blood, pH 7.4 (Robinson 1975); vagina, 4.2 to 6.6 (Wagner and Ottesen 1982); abscess, 6.2 to 7.3 (Bessman, Page et al. 1989); urinary tract (UT), 4.6 to 7 (McClatchey 1994); lung, 6.8 to 7.6 (Cheng, Rodriguez et al. 1998); mouth, 5 to 7 (Dong, Pearce et al. 1999); nose, 6.5 to 7 (England, Homer et al. 1999); skin, 4.2 to 5.9 (Ehlers, Ivens et al. 2001).

References

    1. Arvidson, S., and T. Holme. 1971. Influence of pH on the formation of extracellular proteins by Staphylococcus aureus. Acta Pathol. Microbiol. Scand. B 79:406-413. - PubMed
    1. Arvidson, S., T. Holme, and T. Wadstrom. 1971. Influence of cultivation conditions on the production of extracellular proteins by Staphylococcus aureus. Acta Pathol. Microbiol. Scand. B 79:399-405. - PubMed
    1. Beenken, K. E., P. M. Dunman, F. McAleese, D. Macapagal, E. Murphy, S. J. Projan, J. S. Blevins, and M. S. Smeltzer. 2004. Global gene expression in Staphylococcus aureus biofilms. J. Bacteriol. 186:4665-4684. - PMC - PubMed
    1. Bergdoll, M. S. 1989. Regulation and control of toxic shock syndrome toxin 1: overview. Rev. Infect. Dis. 11(Suppl. 1):S142-S144. - PubMed
    1. Bessman, A. N., J. Page, and L. J. Thomas. 1989. In vivo pH of induced soft-tissue abscesses in diabetic and nondiabetic mice. Diabetes 38:659-662. - PubMed

Publication types

MeSH terms

LinkOut - more resources