. 2005 Jan 12;24(1):44-53.
doi: 10.1038/sj.emboj.7600494. Epub 2004 Dec 2.

A phospholipid sensor controls mechanogating of the K+ channel TREK-1

Affiliations

A phospholipid sensor controls mechanogating of the K+ channel TREK-1

Jean Chemin et al. EMBO J. .

Abstract

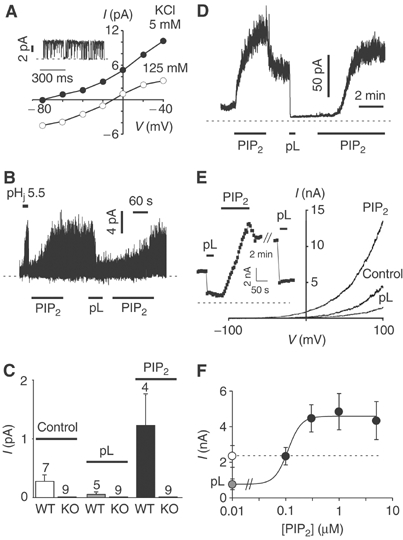
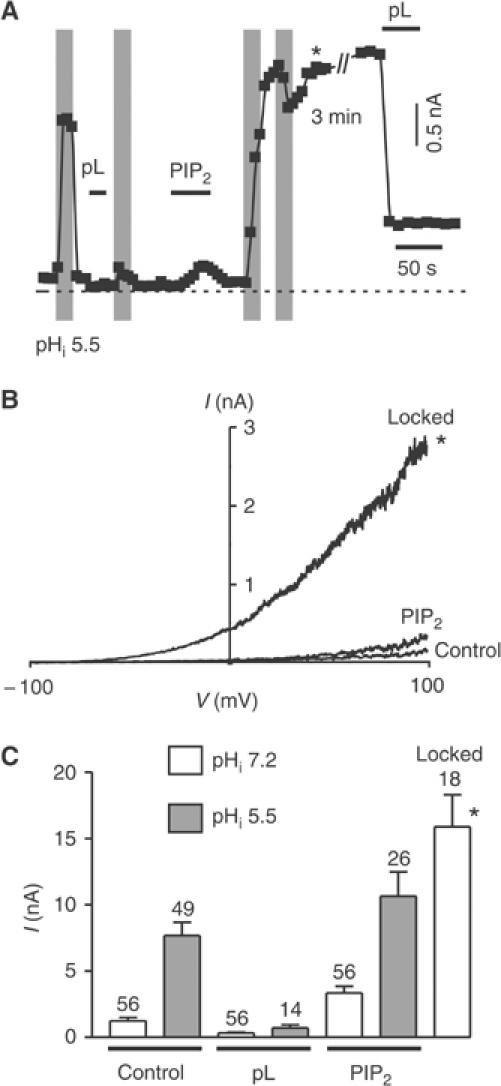
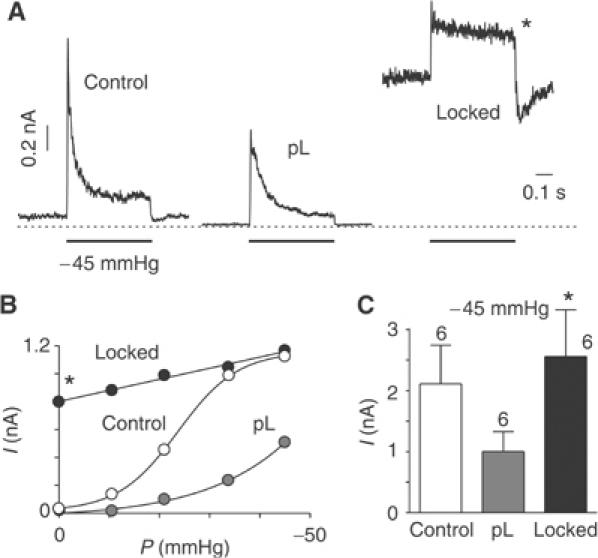
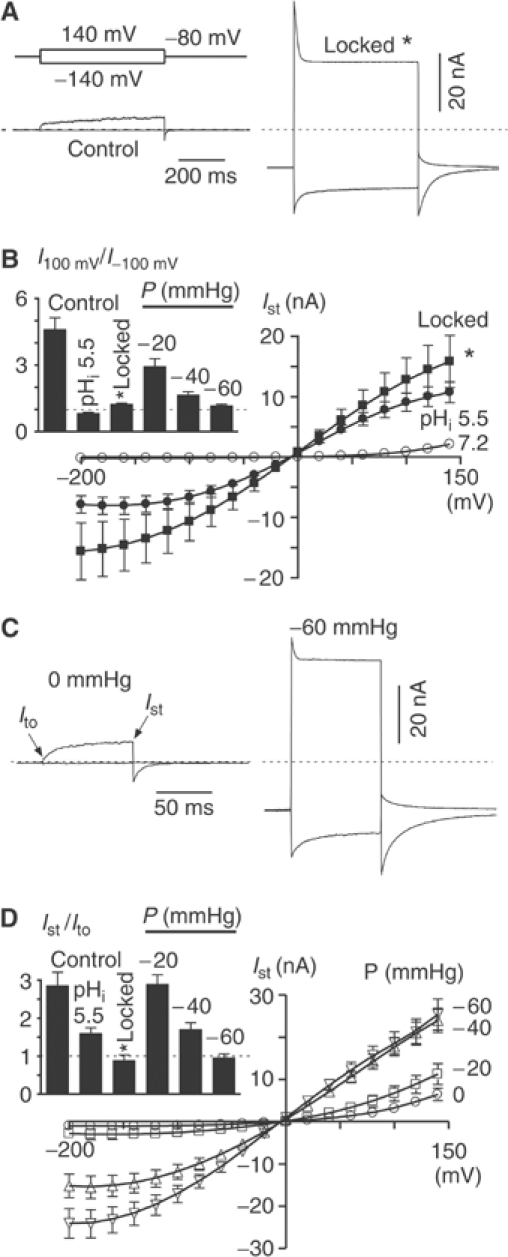
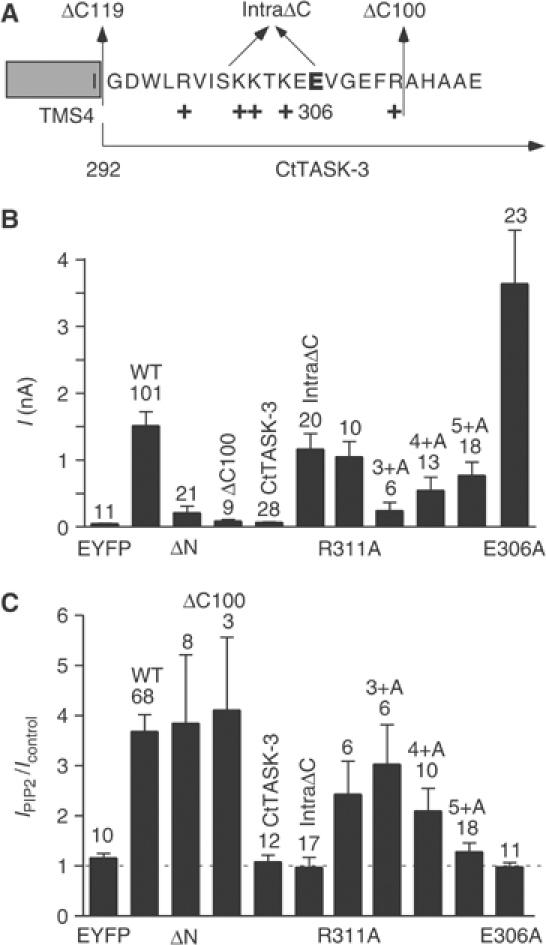
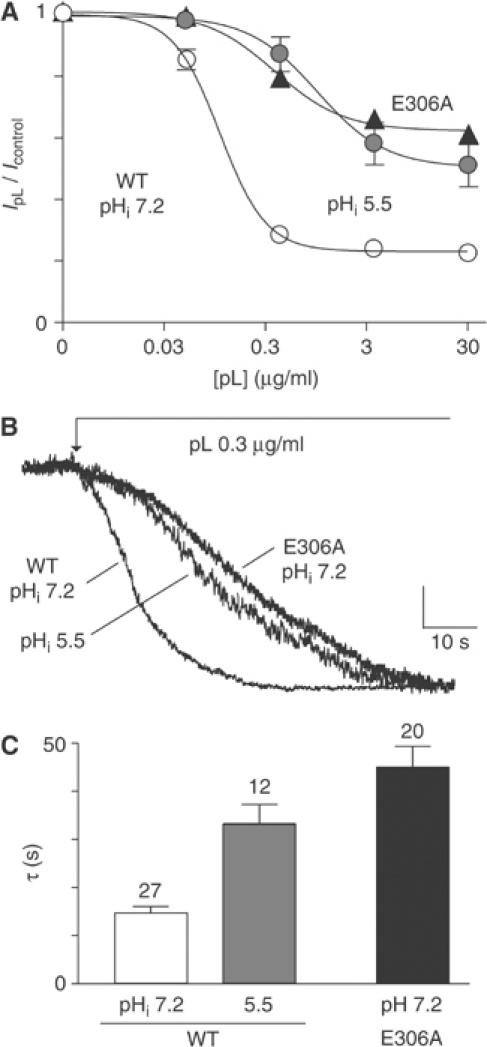
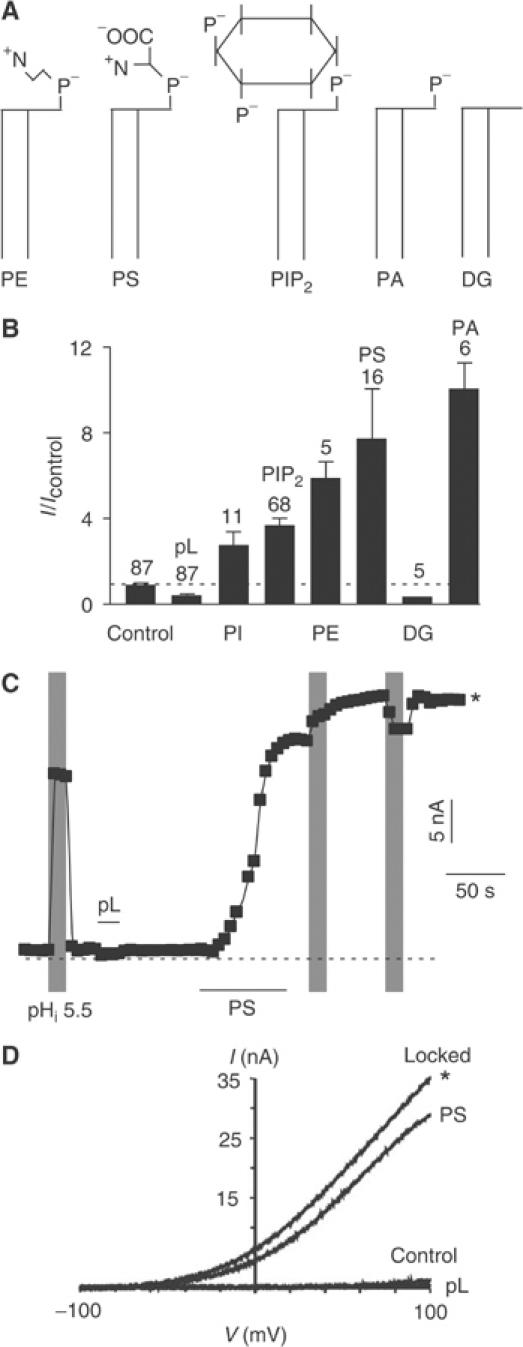
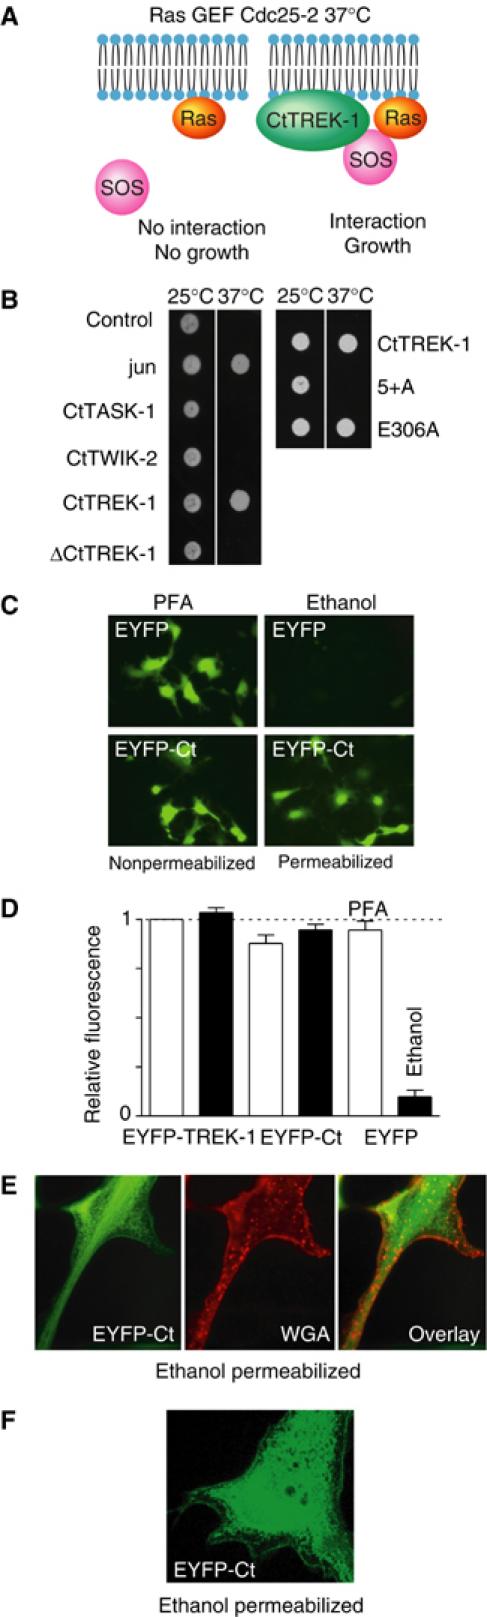
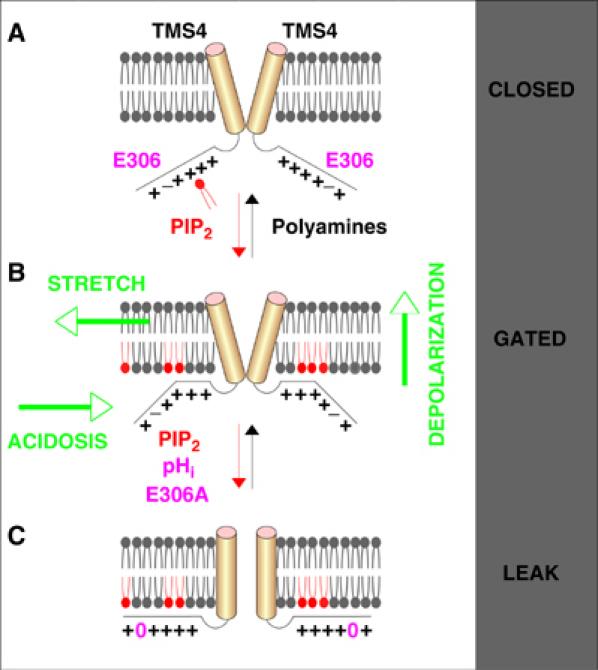
TREK-1 (KCNK2 or K(2P)2.1) is a mechanosensitive K(2P) channel that is opened by membrane stretch as well as cell swelling. Here, we demonstrate that membrane phospholipids, including PIP(2), control channel gating and transform TREK-1 into a leak K(+) conductance. A carboxy-terminal positively charged cluster is the phospholipid-sensing domain that interacts with the plasma membrane. This region also encompasses the proton sensor E306 that is required for activation of TREK-1 by cytosolic acidosis. Protonation of E306 drastically tightens channel-phospholipid interaction and leads to TREK-1 opening at atmospheric pressure. The TREK-1-phospholipid interaction is critical for channel mechano-, pH(i)- and voltage-dependent gating.


Figures

Figure 1
Figure 1
PIP2 stimulates native and cloned TREK-1 channel activity. (A) Endogenous K+ channel activity from cultured mouse striatal neurons was recorded in the presence of extracellular TEA, 4-AP and glibenclamide. A TREK-1-like channel stimulated by cytosolic acidosis to pH 5.5, membrane stretch and AA is recorded under these experimental conditions (Heurteaux et al, 2004). IV curves (inside-out patch) were constructed in the presence of 5 mM (filled symbols) and 125 mM external K+ (empty symbols), with a pHi 5.5. The inset shows a current trace recorded at a holding potential of 0 mV in a physiological K+ gradient. (B) Effects of cytosolic acidosis (pHi 5.5), PIP2 (5 μM) and pL (30 μg/ml) on the endogenous striatal TREK-1 channel recorded in an inside-out patch held at 0 mV (physiological K+ gradient). (C) Histogram summarizing the effect of pL (30 μg/ml) and PIP2 (5 μM) on the mean TREK-1-like current amplitude of cultured striatal neurons from WT and KO mice. (D) Effect of PIP2 (5 μM) and pL (30 μg/ml) on the cloned TREK-1 channel transiently expressed in COS cells and measured in an inside-out patch held at 0 mV (physiological K+ gradient). (E) IV curves elicited by voltage ramps showing the effect of pL and PIP2 in an inside-out patch. The inset shows current amplitude measured at 0 mV. (F) Dose–effect curve of PIP2 on TREK-1 channel activity after pL inhibition. The EC50 value is estimated to be 125 nM (n=10). In COS cells, we also occasionally observed inhibition of TREK-1 control currents at higher concentrations of PIP2 before pL treatment. In (A, B, D and E) inset, the dashed lines indicate the zero current. In (F), the dashed line indicates the control TREK-1 current (empty circles).
Figure 2
Figure 2
Acidic stimulation locks TREK-1 open in the presence of PIP2. (A) Effect of pHi 5.5 (indicated by gray shading) in the absence and the presence of pL (30 μg/ml) and PIP2 (5 μM) on TREK-1 recorded in an inside-out patch measured at 0 mV (physiological K+ gradient). (B) IV curves of TREK-1 elicited by voltage ramps in control, in the presence of PIP2 (5 μM) and during open lock following cytosolic acidosis (pHi 5.5) after PIP2 (5 μM) washout (indicated by a star). (C) The histogram shows the effect of pHi 5.5 (gray columns) in the absence and the presence of pL (30 μg/ml) and PIP2 (5 μM).
Figure 3
Figure 3
PIP2 affects TREK-1 mechanogating. (A) Effect of a membrane pressure of −45 mmHg on TREK-1 channel activity in an inside-out patch held at 0 mV (physiological K+ gradient). pL (30 μg/ml) and PIP2 (5 μM) were added intracellularly. After PIP2 addition (5 μM for 2 min), cytosolic pH was lowered from 7.2 to 5.5 for 30 s. Channels were locked open when returning to pHi 7.2 (indicated by a star). (B) Pressure–effect curve of TREK-1 in control, in the presence of pL (30 μg/ml), and following cytosolic acidosis (pHi 5.5) after PIP2 (5 μM) washout. The pressure–effect curves were fitted with Boltzmann relationships. The P0.5 values are −24 mmHg and estimated at −84 mmHg for control and pL, respectively. The slope factors are 6.0 and 15.2 for control and pL, respectively. (C) Mean current amplitude of TREK-1 at a pressure of −45 mmHg in control, pL (30 μg/ml) and following cytosolic acidosis (pHi 5.5) after PIP2 (5 μM) washout (open lock indicated by a star).
Figure 4
Figure 4
PIP2 affects TREK-1 voltage dependency. (A) Inside-out patches were excised in a symmetrical K+ gradient lacking divalent cations. The holding potential was −80 mV and voltage steps to −140 and 140 mV are illustrated. Currents were recorded in control and following cytosolic acidosis (pHi 5.5) after PIP2 (5 μM) washout (open lock indicated by a star). (B) IV curves (Ist) in control (empty circles) (n=17), at pHi 5.5 (filled circles) (n=17) and following cytosolic acidosis (pHi 5.5) after PIP2 (5 μM) washout (filled squares) (n=5). The inset shows TREK-1 outward rectification determined by the ratio of current amplitude measured at −100 and 100 mV in control (pHi 7.2) (n=34), during cytosolic acidosis (pHi 5.5) (n=17), following cytosolic acidosis (pHi 5.5) after PIP2 (5 μM) washout (open lock indicated by a star) (n=5) and at increasing pressure (n=16, 17 and 7 for −20, −40 and −60 mmHg, respectively). (C) Effect of membrane stretch (−60 mmHg) on TREK-1 voltage dependency (symmetrical K+ gradient). The holding potential was −80 mV and voltage steps to −140 and 140 mV are illustrated. (D) IV curves (Ist) were constructed at increasing pressure (indicated in mmHg) (0 mmHg, n=17; −20 mmHg, n=16; −40 mmHg, n=17 and −60 mmHg, n=10). The inset shows the time dependency of TREK-1 measured at 140 mV and expressed as the ratio of the steady state (Ist) over the initial (Ito) current amplitude in control (pHi 7.2) (n=34), during cytosolic acidosis (pHi 5.5) (n=17), following cytosolic acidosis (pHi 5.5) after PIP2 (5 μM) washout (open lock indicated by a star) (n=5) and at increasing pressure (n=16, 17 and 11 for −20, −40 and −60 mmHg, respectively).
Figure 5
Figure 5
Positive charges in the carboxy-terminal domain of TREK-1 are critically required for PIP2 stimulation. (A) Sequence of the proximal carboxy-terminal domain of TREK-1 illustrating truncation, chimera, as well as point mutations. In the ΔN mutant, the whole amino-terminal domain was deleted (Met was introduced at position 46). In the intraΔC mutant, the region between K301 and E306 was deleted. The ΔC100 mutant was deleted after R311. The ΔC119 was deleted after I292. In the TREK-1/CtTASK-3 chimera, the whole carboxy-terminal domain of TASK-3 was fused to the core of TREK-1 (position 292). In the R311A mutant, arginine at position 311 is substituted by an alanine. In the 3+A mutant R297, K301 and K304 are substituted by an alanine. In the 4+A mutant R297, K301, K302 and K304 are substituted by an alanine. In the 5+A mutant, R297, K301, K302, K304 and R311 are substituted by an alanine. In the E306A mutant, glutamate at position 306 is substituted by an alanine. (B) The histogram illustrates the basal current amplitude of the TREK-1 mutants measured at 0 mV in the inside-out patch configuration. (C) The histogram illustrates the effect of PIP2 (5 μM) after pL (30 μg/ml) treatment.
Figure 6
Figure 6
Cytosolic acidification increases TREK-1/PIP2 interaction. (A) Dose–effect curve of pL on TREK-1 WT at pHi 7.2 (n=8) and pH 5.5 (n=9), and on E306A at pHi 7.2 (n=8). EC50 values are 0.074, 0.774 and 0.285 μg/ml for TREK-1 WT at pH 7.2, pH 5.5 and E306A. Slope factors are 1.62, 1.33 and 1.26 for TREK-1 WT at pH 7.2, pH 5.5 and E306A. (B) Kinetic of current inhibition by 0.3 μg/ml pL. The vertical scale is 300, 200 and 250 pA for WT pH 7.2, WT pH 5.5 and E306A. (C) The histogram shows the mean time constant of current inhibition determined by mono-exponential fitting. In these experiments, inside-out patches were held at 0 mV (physiological K+ gradient). The time constants measured for TREK-1 WT at pHi 5.5 and for E306A at pHi 7.2 are significantly slower (P<0.01) as compared to TREK-1 WT measured at pHi 7.2.
Figure 7
Figure 7
Phospholipid specificity of TREK-1 modulation. (A) Diagram of the different phospholipid molecules. (B) Histogram showing the effect of various phospholipids (5 μM) on TREK-1 currents after pL treatment (30 μg/ml), recorded in inside-out patches and measured at 0 mV (physiological K+ gradient). (C) Effect of cytosolic acidosis to pH 5.5 (indicated by gray shading), pL (30 μg/ml) and PS (5 μM) on TREK-1 recorded in an inside-out patch measured at 0 mV (physiological K+ gradient). (D) IV curves elicited by voltage ramps illustrating the effect of pL (30 μg/ml) and PS (5 μM) before and after cytosolic acidosis to pH 5.5.
Figure 8
Figure 8
Interaction of the carboxy-terminal domain of TREK-1 with the plasma membrane. (A) The yeast SOS recruitment strategy was used to investigate the interaction of the carboxy-terminal domain of TREK-1 with the plasma membrane. Cdc25-2 cells are growing at the permissive temperature of 25°C and Jun dimerization is used as a positive control. At the nonpermissive temperature 37°C, cell growth is impaired. The cartoon illustrates the SOS strategy. (B) In these experiments, the rescue ability of the carboxy-terminal domain of various channels and mutants is illustrated by cell growth (left panel). Effects of the 5+A and E306A mutations on SOS recruitment (right panel). (C) Expression of the cytosolic EYFP and the fusion protein EYFP-CtTREK-1 in transiently transfected COS cells. Cells were fixed with either ethanol permeabilization or in the absence of permeabilization with PFA. Images were acquired with an × 25 oil immersion objective and an EYFP filter. (D) Quantification of the fluorescence in EYFP-TREK-1-, EYFP-Ct TREK-1- and EYFP-transfected COS cells fixed with (ethanol) or without permeabilization (PFA). (E) Cells were ethanol permeabilized and labelled with WGA. Images were collected with an × 63 oil immersion lens and filter sets for EYFP (green) and Cy3 (red). The overlay of EYFP and WGA fluorescence is illustrated in the right panel. (F) Confocal image of an ethanol-permeabilized EYFP-Ct TREK-1-transfected cell acquired with an × 100 oil immersion objective and laser excitation for FITC. The image corresponds to a section of 0.1 μm.
Figure 9
Figure 9
Model of TREK-1 gating. (A) In the presence of pL or endogenous polyamines, TREK-1 is in the closed state and not activable (closed state). (B) Phospholipids, including PIP2, electrostatically interact with the positively charged cluster (5+) in the cytosolic proximal carboxy-terminal domain of TREK-1. Insertion of PIP2 in the inner leaflet of the bilayer controls coupling of the carboxy-terminal domain of TREK-1 with the plasma membrane. When partially coupled, TREK-1 is in the closed state but activable by membrane stretch, depolarization and cytosolic acidosis (gated state). (C) This membrane interaction is favored when the negative charge of the proton sensor E306 is masked by either protonation at acidic pHi or by substitution with an alanine (E306A). The E306A mutant is locked open and behaves as a leak K+ channel. Similarly, in the presence of exogenous phospholipids, cytosolic acidosis irreversibly locks TREK-1 open (leak state).

References

    1. Aronheim A (2001) Ras signaling pathway for analysis of protein–protein interactions. Methods Enzymol 332: 260–270 - PubMed
    1. Bang H, Kim Y, Kim D (2000) TREK-2, a new member of the mechanosensitive tandem pore K+ channel family. J Biol Chem 275: 17412–17419 - PubMed
    1. Baukrowitz T, Schulte U, Oliver D, Herlitze S, Krauter T, Tucker SJ, Ruppersberg JP, Fakler B (1998) PIP2 and PIP as determinants for ATP inhibition of KATP channels. Science 282: 1141–1144 - PubMed
    1. Berg AP, Talley EM, Manger JP, Bayliss DA (2004) Motoneurons express heteromeric TWIK-related acid-sensitive K+ (TASK) channels containing TASK-1 (KCNK3) and TASK-3 (KCNK9) subunits. J Neurosci 24: 6693–6702 - PMC - PubMed
    1. Bockenhauer D, Zilberberg N, Goldstein SA (2001) KCNK2: reversible conversion of a hippocampal potassium leak into a voltage-dependent channel. Nat Neurosci 4: 486–491 - PubMed

MeSH terms

Substances