Review
. 2004 Nov;1(2):e45.
doi: 10.1371/journal.pmed.0010045. Epub 2004 Nov 30.

An inflammatory cascade leading to hyperresistinemia in humans

Affiliations
Review

An inflammatory cascade leading to hyperresistinemia in humans

Michael Lehrke et al. PLoS Med. 2004 Nov.

Abstract

Background: Obesity, the most common cause of insulin resistance, is increasingly recognized as a low-grade inflammatory state. Adipocyte-derived resistin is a circulating protein implicated in insulin resistance in rodents, but the role of human resistin is uncertain because it is produced largely by macrophages.

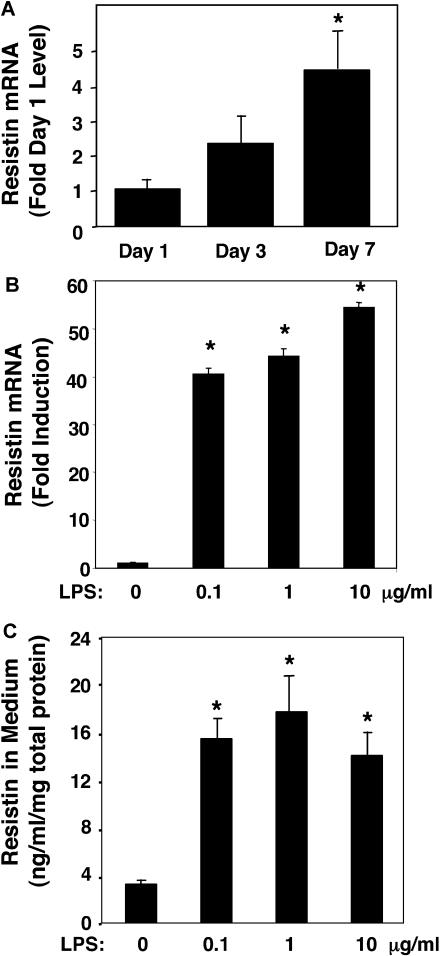
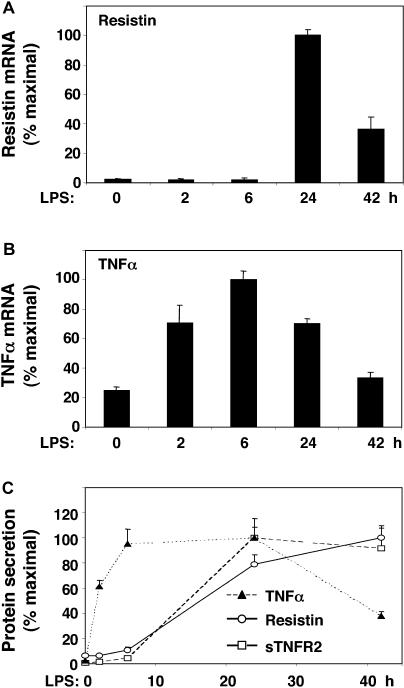
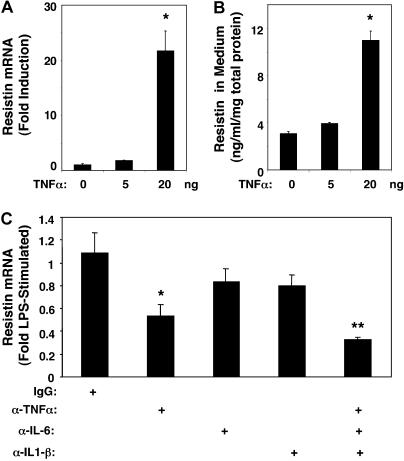
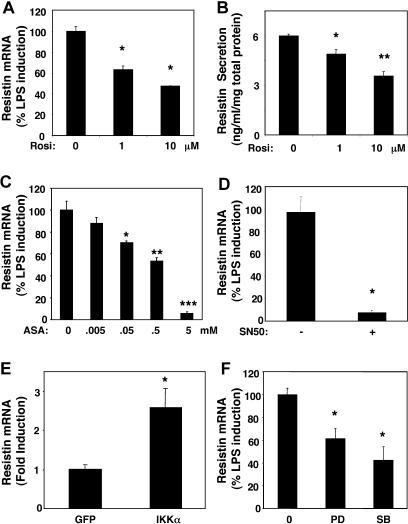
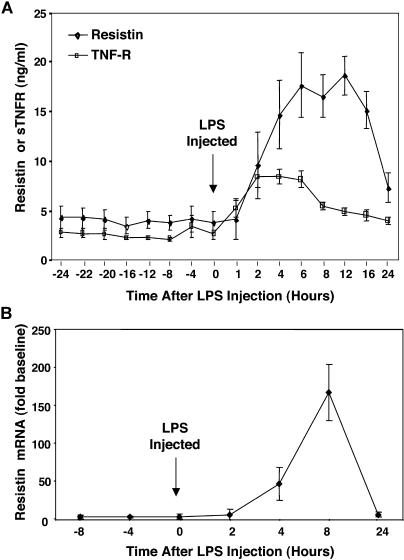
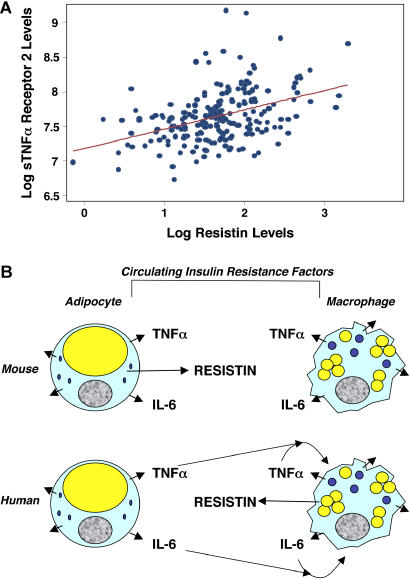
Methods and findings: The effect of endotoxin and cytokines on resistin gene and protein expression was studied in human primary blood monocytes differentiated into macrophages and in healthy human participants. Inflammatory endotoxin induced resistin in primary human macrophages via a cascade involving the secretion of inflammatory cytokines that circulate at increased levels in individuals with obesity. Induction of resistin was attenuated by drugs with dual insulin-sensitizing and anti-inflammatory properties that converge on NF-kappaB. In human study participants, experimental endotoxemia, which produces an insulin-resistant state, causes a dramatic rise in circulating resistin levels. Moreover, in patients with type 2 diabetes, serum resistin levels are correlated with levels of soluble tumor necrosis factor alpha receptor, an inflammatory marker linked to obesity, insulin resistance, and atherosclerosis.

Conclusions: Inflammation is a hyperresistinemic state in humans, and cytokine induction of resistin may contribute to insulin resistance in endotoxemia, obesity, and other inflammatory states.


Conflict of interest statement

Competing Interests: MPR has received research funding or honoraria from GlaxoSmithKline, Merck, Ely Lilly, and KOS Pharmaceuticals. MAL has received a research grant from GlaxoSmithKline and has a United States patent application pending for therapeutic antagonism of human resistin. MAL and the University of Pennsylvania have licensed to Linco the monoclonal antibodies used in the human resistin assay.

Figures

Figure 1
Figure 1. Induction of Resistin in Human Macrophages
(A) Induction of resistin during human macrophage differentiation ex vivo. Expression of resistin on days 1, 3, and 7 following isolation and culture of human peripheral blood monocytes under macrophage differentiation conditions. Results shown are the mean (± SEM) of three separate experiments with triplicate samples. The ANOVA F statistic for change of resistin mRNA expression during differentiation was 7.06 (p < 0.01). *, p < 0.01 for post hoc t-tests. (B) Resistin mRNA is induced by endotoxin in primary human macrophage cultures. The ANOVA F statistic for change of resistin mRNA expression in response to increasing concentration of LPS (24 h treatment) was 423.57 (p < 0.001). *, p < 0.001 for post hoc t-tests. (C) Resistin protein secretion by human macrophages is induced by endotoxin. The ANOVA F statistic for change of resistin protein secretion in response to increasing concentration of LPS (24 h treatment) was 35.36 (p < 0.001). *, p < 0.001 for post hoc t-tests. For LPS dose response studies, shown in (B) and (C), results (mean ± SEM) of representative experiments, with triplicate samples, are presented. Similar results were obtained in two independent experiments.
Figure 2
Figure 2. Endotoxin Induction of Resistin Occurs after Induction of TNFα
Primary cultures of human macrophages were treated with LPS (1 μg/ml) for various times. (A) Time course of induction of resistin mRNA. The ANOVA F statistic for the change in resistin mRNA over time was 105.45 (p < 0.001). (B) Time course of induction of TNFα mRNA. The ANOVA F statistic was 34.57 (p < 0.001). (C) Time course of secretion of resistin, TNFα, and sTNFR2 into medium. ANOVA F statistics for the effect of LPS on resistin (66.51, p < 0.001), sTNFR2 (12.86, p < 0.001), and TNFα (20.48, p < 0.001) were highly significant. Maximal secreted protein levels were as follows: resistin, 21.9 ng/ml/mg; TNFα, 207.2 ng/ml/mg; and sTNFR2, 39.3 ng/ml/mg. Results of representative experiments with triplicate samples are expressed as mean (± SEM). Similar results were obtained in three independent experiments.
Figure 3
Figure 3. Endotoxin-Induced Cytokines Regulate Resistin Induction
(A) TNFα induces production of resistin mRNA by primary human macrophages. The ANOVA F statistic for the effect of increasing TNFα concentrations on resistin was 23.81 (p < 0.001). *, p < 0.001 for post hoc t-tests. (B) TNFα induces resistin protein secretion by primary human macrophages. ANOVA F statistic for the effect of TNFα on resistin was 79.85 (p < 0.001). *, p < 0.005 for post hoc t-tests. Results of representative experiments with triplicate samples are expressed as the mean (± SEM). Similar results were obtained in two independent experiments. (C) LPS (1 μg/ml) induction of resistin is abrogated by antibody neutralization of cytokines (7.5 μg/ml per antibody). ANOVA F statistic for the effect of neutralizing antibodies on resistin was 3.08 (p < 0.05). p-Values for post hoc t-tests versus IgG: *, p < 0.05; **, p < 0.001. Results are expressed as the mean (± SEM) of three separate experiments with triplicate samples.
Figure 4
Figure 4. Inhibition of Resistin Induction by Anti-Inflammatory Insulin Sensitizers
(A) Down-regulation of resistin mRNA by rosiglitazone. ANOVA F statistic for the effect Rosiglitazone on resistin expression was 62.52 (p < 0.001). p value for post hoc t-tests, is depicted in the Figure. *p < 0.005 versus control for post hoc t-tests. (B) Down-regulation of resistin protein secretion by human macrophages treated with rosiglitazone. The ANOVA F statistic for the effect of rosiglitazone on resistin protein secretion was 29.44 (p < 0.001). p-Values for post hoc t-tests versus control: *, p < 0.05; **, p < 0.001. Cells were pre-treated with rosiglitazone for 24 h and with LPS (1 μg/ml) and rosiglitazone for an additional 24 h. Results of representative experiments with triplicate samples are expressed as mean (± SEM). Similar results were obtained in three independent experiments. (C) Down-regulation of resistin gene expression by aspirin. The ANOVA F statistic for the effect of aspirin on resistin expression was 61.33 (p < 0.001). p-Values for post hoc t-tests versus no aspirin: *, p < 0.01; **, p < 0.001; ***, p < 0.0001. Cells were pre-treated with aspirin for 2 h and with LPS (1 μ g/ml) and aspirin for an additional 24 h. Results of representative experiments with triplicate samples are expressed as mean (± SEM). Similar results were obtained in two independent experiments. (D) Down-regulation of resistin gene expression by NF-κB inhibitor SN50. *, p < 0.001 versus control peptide by t-test. Cells were pre-treated with SN50 or control peptide at 100 ug/ml for 2 h, and with LPS (1 μg/ml) and SN50 or control peptide for an additional 24 h. Results are the expressed as the mean (± SEM) of two independent experiments performed in triplicate. (E) Induction of resistin by activation of NF-κB. *, p < 0.05 versus control virus by t-test. Cells were infected with adenovirus expressing activated IKK or control virus for 24 h. Results of representative experiments with triplicate samples are expressed as mean (± SEM). Similar results were obtained in two independent experiments. (F) Down-regulation of resistin gene expression by inhibitors of p38 and p42 MAPK. The ANOVA F statistic for the effect of the MAPK inhibitor on resistin expression was 11.54 (p < 0.005). *, p < 0.005 versus control for post hoc t-tests. Cells were pretreated with 50 μM PD98059 or 2.5 μM SB20358 for 2 h and with LPS (1 μg/ml) and PD98059 or SB20358 for an additional 24 h. Results are expressed as the mean (± SEM) of two independent experiments performed in triplicate.
Figure 5
Figure 5. Endotoxin Dramatically Induces Plasma Resistin in Humans
(A) Plasma resistin and sTNFR2 levels were measured serially in six healthy volunteers for 24 h before and after intravenous LPS (3 ng/kg) administration. The repeated measures ANOVA F statistics for the effect of LPS on plasma resistin (9.25, p < 0.001) and sTNFR2 (23.65, p < 0.001) were highly significant. (B) Mean resistin RNA expression in whole blood cells of healthy volunteers (n = 2) before and after treatment with LPS (3 ng/kg).
Figure 6
Figure 6. Plasma Resistin Levels Correlate with sTNFR2 Levels in Humans with Type 2 Diabetes
(A) The correlation (Spearman coefficient rho = 0.38, p < 0.001) of plasma resistin and sTNFR2 levels in 215 humans with type 2 diabetes is presented. The line represents the linear regression fit between log-transformed plasma levels of resistin and sTNFR2. (B) Model to explain hyperresistinemia in mice and humans with obesity despite the species differences in the source of plasma resistin. Circulating inflammatory cytokines TNFα and IL-6 are depicted because of their role in resistin induction in human macrophages and their implied role in insulin resistance. Other cytokines and inflammatory markers may also contribute to insulin resistance and/or resistin induction.

Similar articles

Cited by

References

    1. Ogden CL, Carroll MD, Flegal KM. Epidemiologic trends in overweight and obesity. Endocrinol Metab Clin North Am. 2003;32:741–760. - PubMed
    1. Flier JS. Obesity wars: Molecular progress confronts an expanding epidemic. Cell. 2004;116:337–350. - PubMed
    1. Sowers JR, Frohlich ED. Insulin and insulin resistance: Impact on blood pressure and cardiovascular disease. Med Clin North Am. 2004;88:63–82. - PubMed
    1. Haffner SM. Insulin resistance, inflammation, and the prediabetic state. Am J Cardiol. 2003;92:18J-26J. - PubMed
    1. Rajala MW, Scherer PE. Minireview: The adipocyte—at the crossroads of energy homeostasis, inflammation, and atherosclerosis. Endocrinology. 2003;144:3765–3773. - PubMed

Publication types