

Pharmacokinetics of 1-nitrosomelatonin and detection by EPR using iron dithiocarbamate complex in mice
- PMID: 15579132
- PMCID: PMC1134976
- DOI: 10.1042/BJ20040828
Pharmacokinetics of 1-nitrosomelatonin and detection by EPR using iron dithiocarbamate complex in mice
Abstract
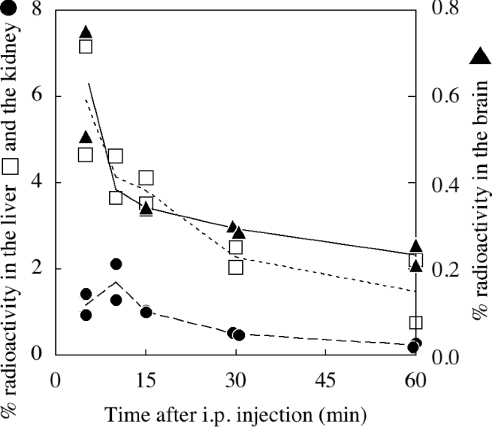
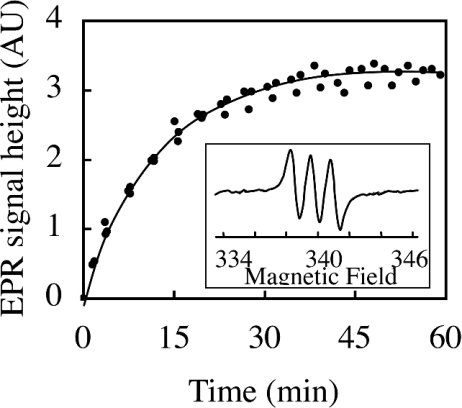
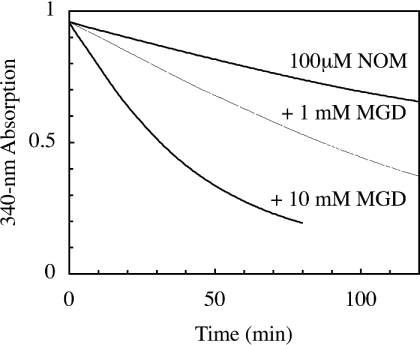
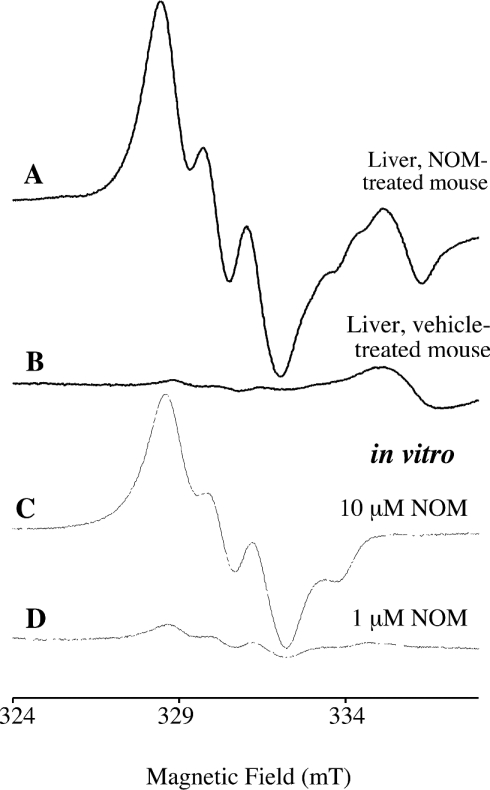
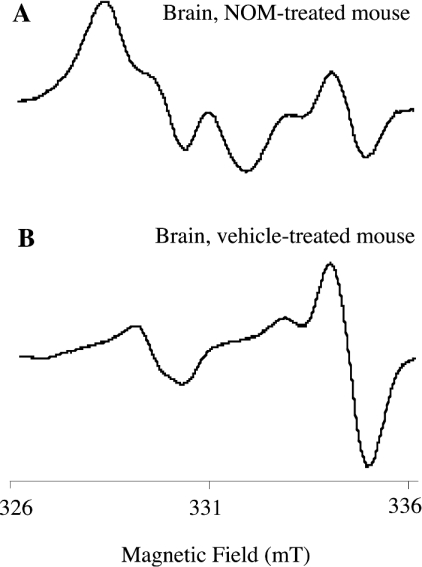
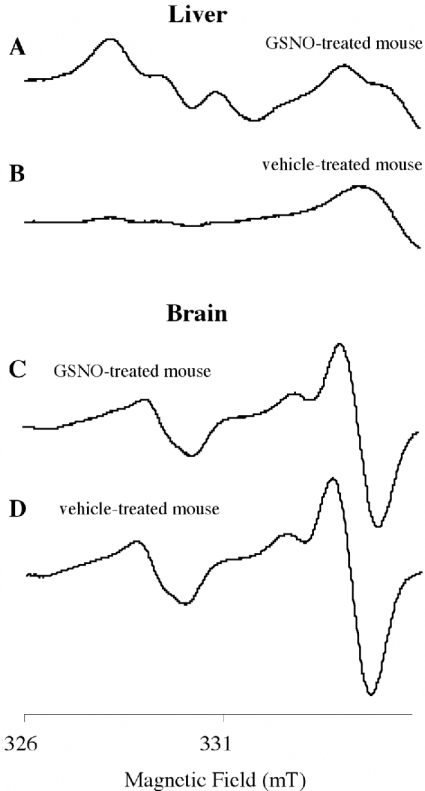
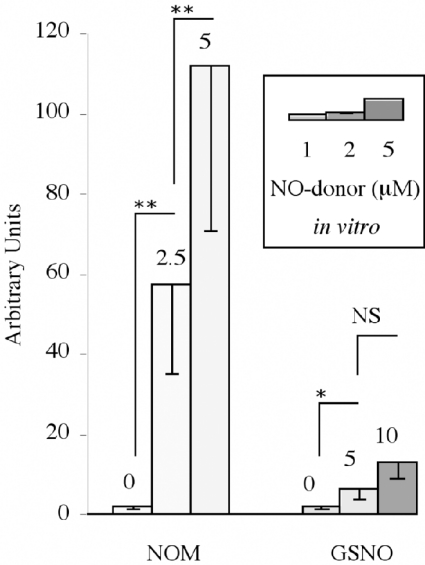
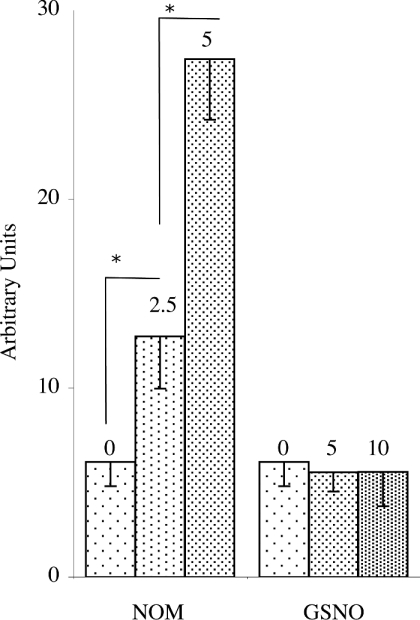
The N-nitroso-derivative of melatonin, NOM (1-nitrosomelatonin), which has been demonstrated to be a NO* [oxidonitrogen*] donor in buffered solutions, is a new potential drug particularly in neurological diseases. The advantage of NOM, a very lipophilic drug, is its ability to release both melatonin and NO*, an easily diffusible free radical. In order to evaluate the distribution and the pharmacokinetics of NOM, [O-methyl-3H]NOM was administered to and followed in mice. A complementary method for monitoring NOM, EPR, was performed in vitro and ex vivo with (MGD)2-Fe2+ (iron-N-methyl-D-glucamine dithiocarbamate) complex as a spin trap. The behaviour of NOM was compared with that of GSNO (S-nitrosoglutathione), a hydrophilic NO* donor. In the first minutes following [O-methyl-3H]NOM intraperitoneal injection, the radioactivity was found in organs (6% in the liver, 1% in the kidney and 0.6% in the brain), but not in the blood. In both liver and brain, the radioactivity content decreased over time with similar kinetics reflecting the diffusion and metabolism of NOM and of its metabolites. Based on the characterization and the quantification of the EPR signal in vitro with NOM or GSNO using (MGD)2-Fe2+ complex in phosphate-buffered solutions, the detection of these nitroso compounds was realized ex vivo in mouse tissue extracts. (MGD)2-Fe2+-NO was observed in the brain of NOM-treated mice in the first 10 min following injection, revealing that NOM was able to cross the blood-brain barrier, while GSNO was not.
Figures
Similar articles
-
The mechanisms of S-nitrosothiol decomposition catalyzed by iron.Nitric Oxide. 2004 Mar;10(2):60-73. doi: 10.1016/j.niox.2004.02.005. Nitric Oxide. 2004. PMID: 15135359
-
Spin trapping of nitric oxide produced in vivo in septic-shock mice.FEBS Lett. 1994 May 30;345(2-3):120-4. doi: 10.1016/0014-5793(94)00422-6. FEBS Lett. 1994. PMID: 8200442
-
Detection of nitric oxide production in mice by spin-trapping electron paramagnetic resonance spectroscopy.Biochim Biophys Acta. 1995 Aug 15;1272(1):29-36. doi: 10.1016/0925-4439(95)00061-8. Biochim Biophys Acta. 1995. PMID: 7662717
-
In vivo spin trapping of nitric oxide.Antioxid Redox Signal. 2004 Jun;6(3):649-56. doi: 10.1089/152308604773934413. Antioxid Redox Signal. 2004. PMID: 15130292 Review.
-
Detection and imaging of endogenously produced nitric oxide with electron paramagnetic resonance spectroscopy.Antioxid Redox Signal. 2000 Winter;2(4):879-901. doi: 10.1089/ars.2000.2.4-879. Antioxid Redox Signal. 2000. PMID: 11213490 Review.
Cited by
-
Detection of Reactive Oxygen and Nitrogen Species by Electron Paramagnetic Resonance (EPR) Technique.Molecules. 2017 Jan 21;22(1):181. doi: 10.3390/molecules22010181. Molecules. 2017. PMID: 28117726 Free PMC article. Review.
-
N-nitrosomelatonin enhances photic synchronization of mammalian circadian rhythms.J Neurochem. 2014 Apr;129(1):60-71. doi: 10.1111/jnc.12613. Epub 2013 Dec 4. J Neurochem. 2014. PMID: 24261470 Free PMC article.
-
Melatonin-Nitric Oxide Crosstalk in Plants and the Prospects of NOMela as a Nitric Oxide Donor.Int J Mol Sci. 2024 Aug 5;25(15):8535. doi: 10.3390/ijms25158535. Int J Mol Sci. 2024. PMID: 39126104 Free PMC article. Review.
-
S-nitrosoglutathione prevents experimental cerebral malaria.J Neuroimmune Pharmacol. 2012 Jun;7(2):477-87. doi: 10.1007/s11481-012-9343-6. Epub 2012 Mar 6. J Neuroimmune Pharmacol. 2012. PMID: 22391863 Free PMC article.
-
Melatonin metabolism in the central nervous system.Curr Neuropharmacol. 2010 Sep;8(3):168-81. doi: 10.2174/157015910792246244. Curr Neuropharmacol. 2010. PMID: 21358968 Free PMC article.
References
-
- Feelisch M., Rassaf T., Mnaimneh S., Singh N., Bryan N. S., Jourd'heuil D., Kelm M. Concomitant S-, N-, and heme-nitros(yl)ation in biological tissues and fluids: implications for the fate of NO in vivo. FASEB J. 2002;16:1775–1785. - PubMed
-
- Blanchard B., Pompon D., Ducrocq C. Nitrosation of melatonin by nitric oxide and peroxynitrite. J. Pineal Res. 2000;29:184–192. - PubMed
-
- Peyrot F., Martin M.-T., Migault J., Ducrocq C. Reactivity of peroxynitrite with melatonin as a function of pH and CO2 content. Eur. J. Org. Chem. 2003;2003:172–181.
-
- Blanchard-Fillion B., Servy C., Ducrocq C. 1-Nitrosomelatonin is a spontaneous NO-releasing compound. Free Radical Res. 2001;35:857–866. - PubMed
-
- Matsubara E., Bryant-Thomas T., Quinto J. P., Henry T. L., Poeggeler B., Herbert D., Cruz-Sanchez F., Chyan Y.-J., Smith M. A., Perry G., et al. Melatonin increases survival and inhibits oxidative and amyloid pathology in a transgenic model of Alzheimer's disease. J. Neurochem. 2003;85:1101–1108. - PubMed
Publication types
MeSH terms
Substances
LinkOut - more resources
Full Text Sources