. 2004 Nov;168(3):1699-712.
doi: 10.1534/genetics.104.030171.

Maximum-likelihood estimation of demographic parameters using the frequency spectrum of unlinked single-nucleotide polymorphisms

Affiliations

Maximum-likelihood estimation of demographic parameters using the frequency spectrum of unlinked single-nucleotide polymorphisms

Alison M Adams et al. Genetics. 2004 Nov.

Abstract

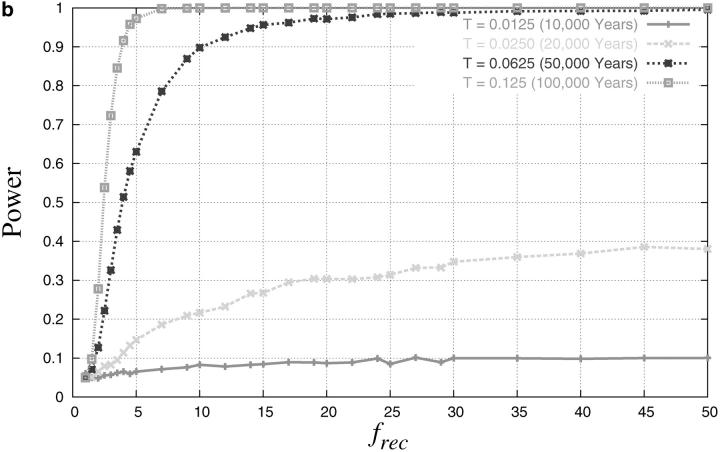
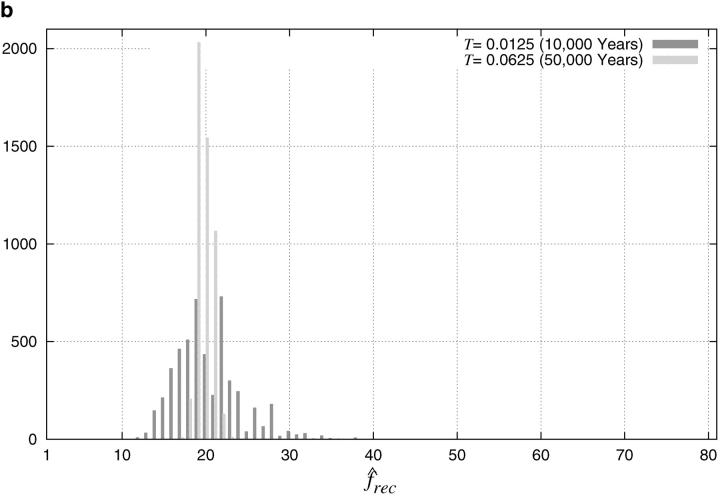
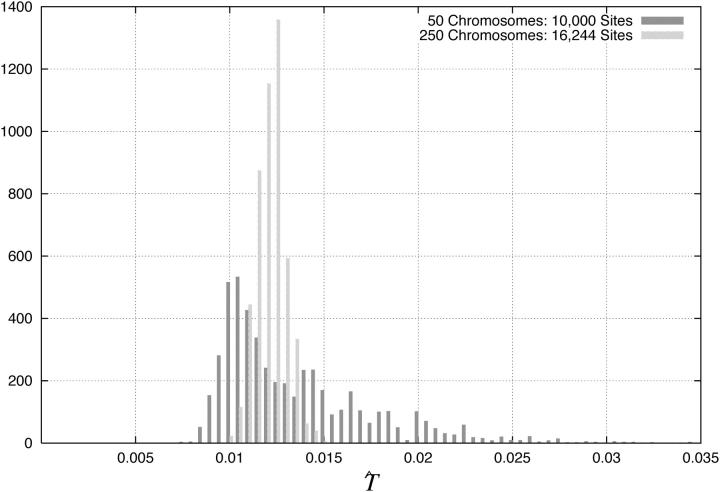
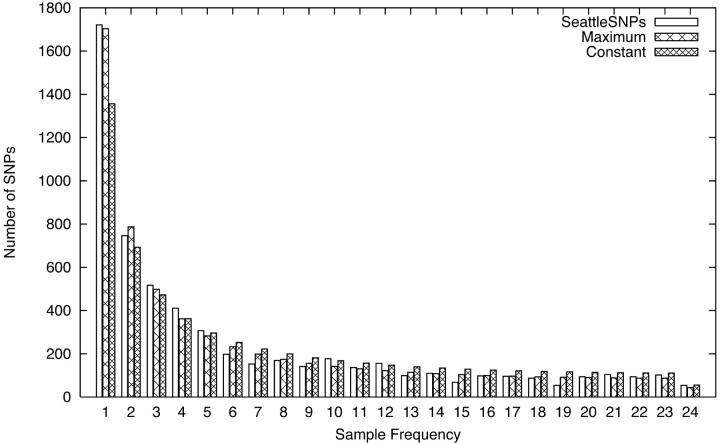
A maximum-likelihood method for demographic inference is applied to data sets consisting of the frequency spectrum of unlinked single-nucleotide polymorphisms (SNPs). We use simulation analyses to explore the effect of sample size and number of polymorphic sites on both the power to reject the null hypothesis of constant population size and the properties of two- and three-dimensional maximum-likelihood estimators (MLEs). Large amounts of data are required to produce accurate demographic inferences, particularly for scenarios of recent growth. Properties of the MLEs are highly dependent upon the demographic scenario, as estimates improve with a more ancient time of growth onset and smaller degree of growth. Severe episodes of growth lead to an upward bias in the estimates of the current population size, and that bias increases with the magnitude of growth. One data set of African origin supports a model of mild, ancient growth, and another is compatible with both constant population size and a variety of growth scenarios, rejecting greater than fivefold growth beginning >36,000 years ago. Analysis of a data set of European origin indicates a bottlenecked population history, with an 85% population reduction occurring approximately 30,000 years ago.


Figures

F<sc>igure</sc> 1.—
Figure 1.—
Demographic model. fint (= Nint/N0), frec (= Nrec/N0), and T are the estimated parameters.
F<sc>igure</sc> 2.—
Figure 2.—
Power to detect growth with ∼500 unlinked sites. The number of sites used for each point in a curve is scaled on the basis of 500 sites in a sample size of 20. (a) Effect of sample size on power to detect recent growth beginning 10,000 years ago (T = 0.0125). (b) Effect of the onset time of growth on power to detect growth with a sample size of 20.
F<sc>igure</sc> 3.—
Figure 3.—
Distribution of rec estimates. Histograms are based on 5000 simulated data sets where frec = 20 and fint is fixed at 1. (a) 50 chromosomes, 10,000 sites; (b) 250 chromosomes, 16,244 sites (T = 0.0125) and 20,322 sites (T = 0.0625).
F<sc>igure</sc> 3.—
Figure 3.—
Distribution of rec estimates. Histograms are based on 5000 simulated data sets where frec = 20 and fint is fixed at 1. (a) 50 chromosomes, 10,000 sites; (b) 250 chromosomes, 16,244 sites (T = 0.0125) and 20,322 sites (T = 0.0625).
F<sc>igure</sc> 4.—
Figure 4.—
Distribution of estimates. Histograms are based on 5000 simulated data sets with parameters frec = 20, fint = 1 (fixed), T = 0.0125, each consisting of 10,000 polymorphic sites in 50 chromosomes or 16,244 polymorphic sites in 250 chromosomes.
F<sc>igure</sc> 5.—
Figure 5.—
African-American Seattle SNPs folded frequency spectra comparison. Empirical Seattle SNPs frequency spectrum and the expected frequency spectrum for demographic parameters corresponding to the Seattle SNPs maximum-likelihood estimate (frec = 1.9, fint = 1, and T = 0.27) and constant population size are shown. The number of SNPs at a sample frequency of i is equal to the total number of SNPs (5892) times pi (folded). For constant population size, pi's are obtained from Equation 9, and, for the maximum-likelihood parameters, pi's are obtained from simulation as described in the text.
F<sc>igure</sc> 6.—
Figure 6.—
Hausa confidence region. The third dimension, fint, is fixed at 1. (a) Maximum-likelihood estimate (MLE) is indicated by the arrow (rec = 3.1, = 6.1). (b) Focus on recent growth times with expanded frec range. The leftmost, middle, and rightmost contours represent the 95, 99, and 99.9% confidence intervals (3.86, 6.38, and 10.08 log-likelihood units, respectively).
F<sc>igure</sc> 7.—
Figure 7.—
Seattle SNPs confidence regions. (a) African-American data set, with MLE indicated by the arrow (rec = 1.9, = 0.27). The third dimension, fint, is fixed at the MLE of int = 1. (b) European data set, with MLE indicated by the arrow (int = 0.15, = 0.0375). The third dimension (frec) is fixed at the MLE of rec = 2.0. The innermost, middle, and outermost contours surrounding the MLE represent the 95, 99, and 99.9% confidence regions, respectively.

References

    1. Aris-Brosou, S., and L. Excoffier, 1996. The impact of population expansion and mutation rate heterogeneity on DNA sequence polymorphism. Mol. Biol. Evol. 13(3): 494–504. - PubMed
    1. Beerli, P., and J. Felsenstein, 2001. Maximum likelihood estimation of a migration matrix and effective population sizes in n subpopulations by using a coalescent approach. Proc. Natl. Acad. Sci. USA 98: 4563–4568. - PMC - PubMed
    1. Cargill, M., D. Altshuler, J. Ireland, P. Sklar, K. Ardlie et al., 1999. Characterization of single-nucleotide polymorphisms in coding regions of human genes. Nat. Genet. 22: 231–238. - PubMed
    1. Ewens, W. J., 1979 Mathematical Population Genetics. Springer-Verlag, New York.
    1. Fay, J. C., J. Wyckoff and C.-I Wu, 2001. Positive and negative selection on the human genome. Genetics 158: 1227–1234. - PMC - PubMed

Publication types