

Evolution of dominance in metabolic pathways
- PMID: 15579719
- PMCID: PMC1448794
- DOI: 10.1534/genetics.104.028696
Evolution of dominance in metabolic pathways
Abstract
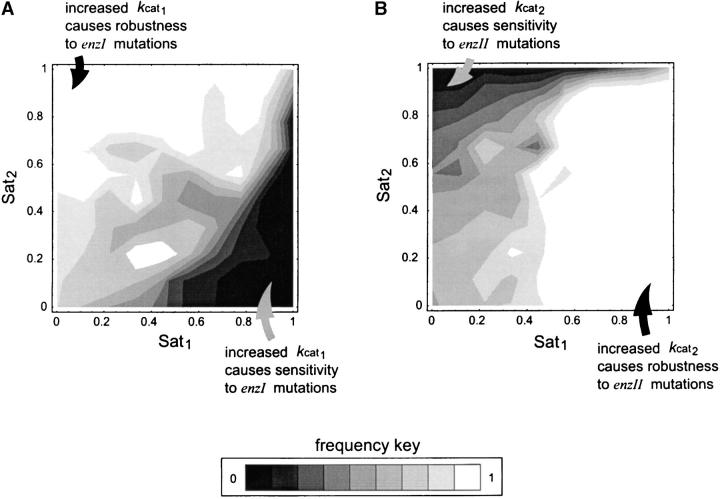
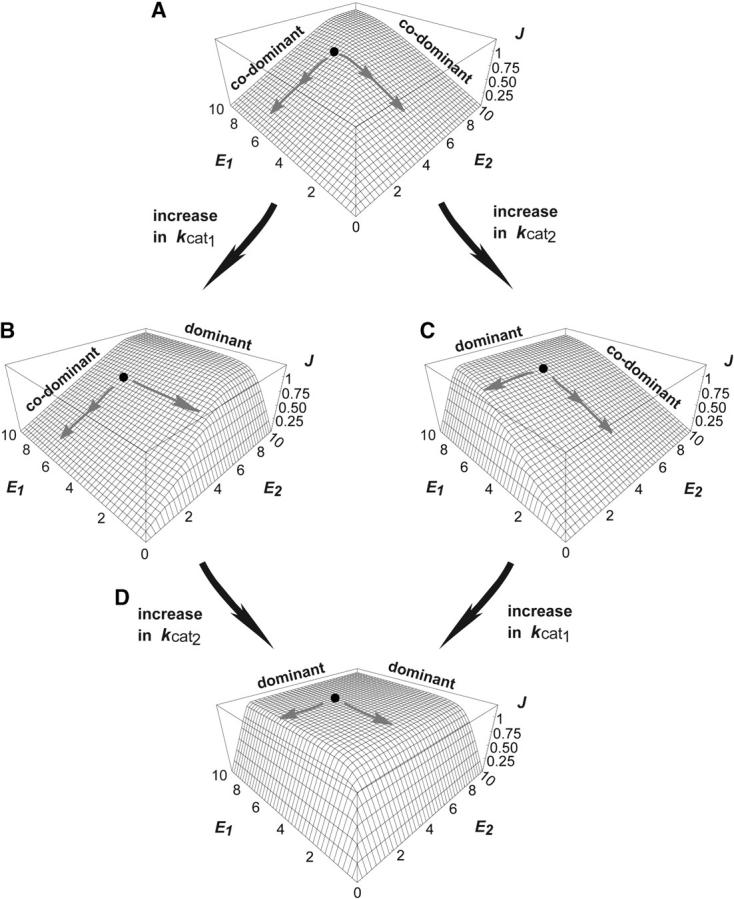
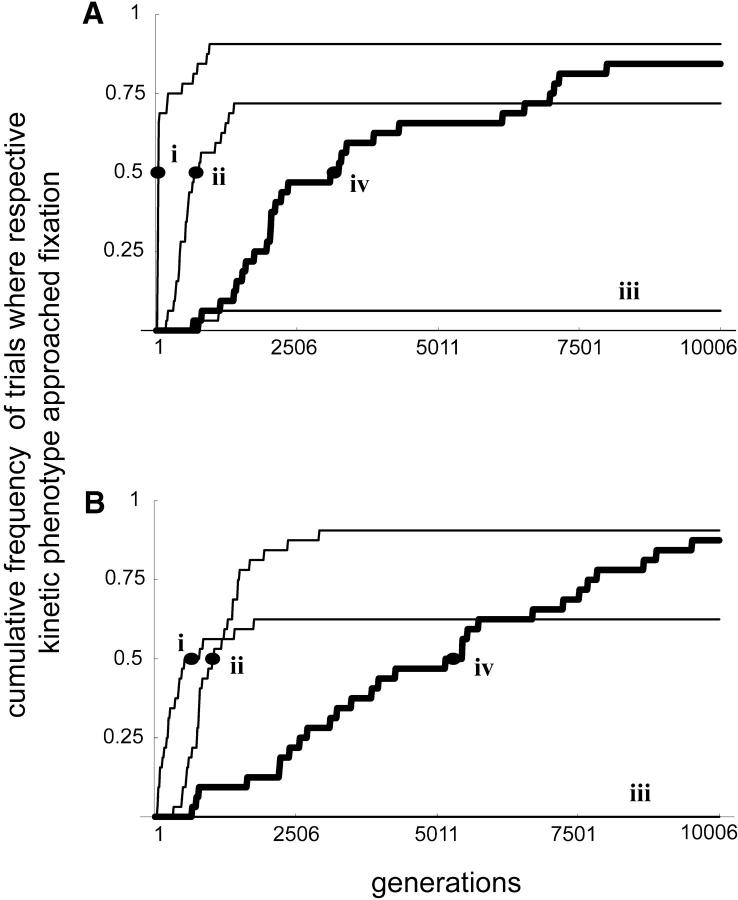
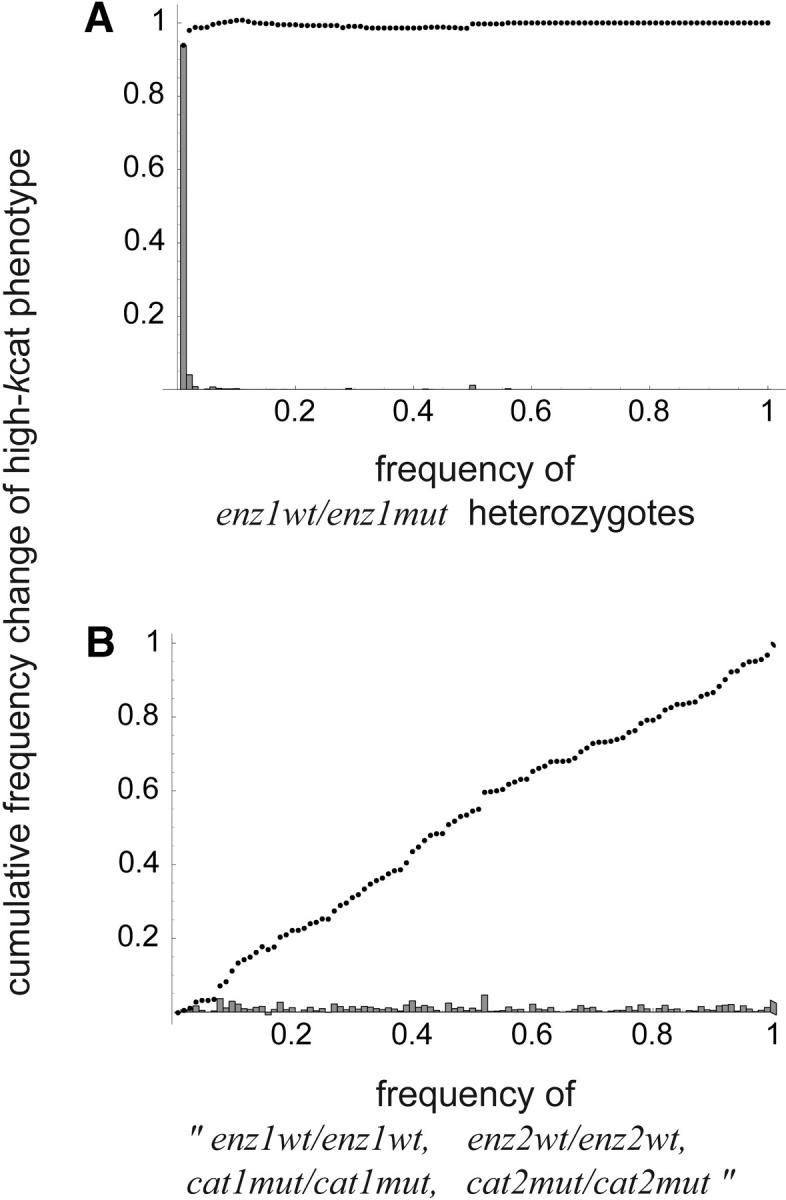
Dominance is a form of phenotypic robustness to mutations. Understanding how such robustness can evolve provides a window into how the relation between genotype and phenotype can evolve. As such, the issue of dominance evolution is a question about the evolution of inheritance systems. Attempts at explaining the evolution of dominance have run into two problems. One is that selection for dominance is sensitive to the frequency of heterozygotes. Accordingly, dominance cannot evolve unless special conditions lead to the presence of a high frequency of mutant alleles in the population. Second, on the basis of theoretical results in metabolic control analysis, it has been proposed that metabolic systems possess inherent constraints. These hypothetical constraints imply the default manifestation of dominance of the wild type with respect to the effects of mutations at most loci. Hence, some biologists have maintained that an evolutionary explanation is not relevant to dominance. In this article, we put into question the hypothetical assumption of default metabolic constraints. We show that this assumption is based on an exclusion of important nonlinear interactions that can occur between enzymes in a pathway. With an a priori exclusion of such interactions, the possibility of epistasis and hence dominance modification is eliminated. We present a theoretical model that integrates enzyme kinetics and population genetics to address dominance evolution in metabolic pathways. In the case of mutations that decrease enzyme concentrations, and given the mechanistic constraints of Michaelis-Menten-type catalysis, it is shown that dominance of the wild type can be extensively modified in a two-enzyme pathway. Moreover, we discuss analytical results indicating that the conclusions from the two-enzyme case can be generalized to any number of enzymes. Dominance modification is achieved chiefly through changes in enzyme concentrations or kinetic parameters such as k(cat), both of which can alter saturation levels. Low saturation translates into higher levels of dominance with respect to mutations that decrease enzyme concentrations. Furthermore, it is shown that in the two-enzyme example, dominance evolves as a by-product of selection in a manner that is insensitive to the frequency of heterozygotes. Using variation in k(cat) as an example of modifier mutations, it is shown that the latter can have direct fitness effects in addition to dominance modification effects. Dominance evolution can occur in a frequency-insensitive manner as a result of selection for such dual-effects alleles. This type of selection may prove to be a common pattern for the evolution of phenotypic robustness to mutations.
Figures
References
-
- Acerenza, L., 2000. Design of large metabolic responses, constraints and sensitivity analysis. J. Theor. Biol. 207: 265–282. - PubMed
-
- Albe, K., M. Butler and B. Wright, 1990. Cellular concentrations of enzymes and their substrates. J. Theor. Biol. 143: 163–195. - PubMed
-
- Ancel, L. W., and W. Fontana, 2000. Plasticity, evolvability and modularity in RNA. J. Exp. Zool. (Mol. Dev. Evol.) 288: 242–283. - PubMed
-
- Bagheri-Chaichian, H., J. Hermisson, J. R. Vaisnys and G. P. Wagner, 2003. Effects of epistasis on phenotypic robustness in metabolic pathways. Math. Biosci. 184: 27–51. - PubMed
-
- Bergman, A., and M. L. Siegal, 2003. Evolutionary capacitance as a general feature of complex gene networks. Nature 424: 549–552. - PubMed
Publication types
MeSH terms
Substances
LinkOut - more resources
Full Text Sources
Molecular Biology Databases
Research Materials
Miscellaneous
