. 2005 Feb;95(3):439-47.
doi: 10.1093/aob/mci042. Epub 2004 Dec 6.

Analysis of the tomato fruit growth response to temperature and plant fruit load in relation to cell division, cell expansion and DNA endoreduplication

Affiliations

Analysis of the tomato fruit growth response to temperature and plant fruit load in relation to cell division, cell expansion and DNA endoreduplication

N Bertin. Ann Bot. 2005 Feb.

Abstract

Background and aims: To better understand the regulation of fruit growth in response to environmental factors, the effects of temperature and plant fruit load on cell number, cell size and DNA endoreduplication were analysed.

Methods: Plants were grown at 20/20 degrees C, 25/25 degrees C and 25/20 degrees C day/night temperatures, and inflorescences were pruned to two ('2F') or five ('5F') flowers.

Key results and conclusions: Despite a lower fruit growth rate at 20/20 degrees C, temperature did not affect final fruit size because of the compensation between cell number and size. The higher cell number at 20/20 degrees C (9.0 x 10(6) against 7.9 x 10(6) at 25/25 degrees C and 7.7 x 10(6) at 25/20 degrees C) resulted from an extended period of cell division, and the smaller cell size was due to a shorter period of expansion rather than a lower expansion rate. By contrast, the lower fruit growth rate and size of 5F fruits compared with 2F fruits resulted from the slow down of cell expansion, whereas the number of cells was hardly affected in the proximal fruit. However, within the inflorescence the decreasing gradient of fruit size from proximal to distal fruits was due to a decrease in cell number with similar cell size. Fruit size variations within each treatment were always positively correlated to variations in cell number, but not in cell size. Negative correlations between cell size and cell number suggested that cells of tomato pericarp can be seen as a population of competing sinks. Mean ploidy was slightly delayed and reduced in 5F fruits compared with 2F fruits. It was highest at 25/25 degrees C and lowest at 25/20 degrees C. Treatments did not affect ploidy and cell size in similar ways, but within each treatment, positive correlations existed between mean ploidy and cell size, though significant only in the 2F-25/20 treatment.


Figures

F<sc>ig</sc>. 1.
Fig. 1.
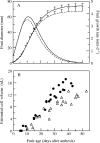
(A) Fruit size and fruit growth rate measured on 2F plants grown at 20/20 °C (dashed line), 25/25 °C (dotted line) or 25/20 °C (continuous line) day/night temperature. Three-parameter Gompertz functions were fitted on fruit size measurements made on the first and second fruits (F1 and F2) of the first four trusses. Adjustment was made on pooled data from six plants (R2 > 0·95) and vertical bars indicate the standard error calculated on adjustments made on individual plants. Daily fruit growth rates were obtained by derivative functions. (B) Change in cell volume during fruit ageing, estimated by dividing the pericarp volume by the total number of pericarp cells in 2F treatments. Each point is an individual fruit sampled at the first or second positions (F1 and F2) on the first eight trusses of four plants grown at 20/20 °C (open circles), 25/25 °C (grey circles) or 25/20 °C (black circles) day/night temperature.
F<sc>ig</sc>. 2.
Fig. 2.
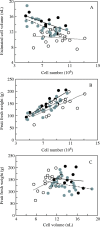
Correlations between (A) cell size and cell number, (B) fruit fresh weight and cell number and (C) fruit fresh weight and cell size. Lines represent linear adjustments. Each point is an individual fruit older than 30 daa sampled at the first or second position (F1 and F2) in the first four trusses of plants grown at 20/20 °C [open circles and dotted line R = −0·17 (A), 0·73 (B), 0·53 (C)], 25/25 °C [grey circles and dashed line R = −0·66 (A), 0·87 (B), −0·25 (C)] or 25/20 °C [black circles and continuous line R = −0·60 (A), 0·86 (B), −0·12 (C)] day/night temperature.
F<sc>ig</sc>. 3.
Fig. 3.
(A) Fruit size and fruit growth rate of the first fruit (F1) of 2F (continuous line) and 5F (broken line) plants grown at 25/20 °C. Three-parameter Gompertz functions were fitted on fruit size measurements made on the first four trusses. Adjustment was made on pooled data from six plants (R2 > 0·85) and vertical bars indicate the standard error calculated on adjustments made on individual plants. Daily fruit growth rates were obtained by derivative functions. (B) Evolution of cell volume during fruit ageing. Each point is an individual fruit sampled at the first position (F1) on the first eight trusses of four 2F (circles) and 5F (triangles) plants grown at 25/20 °C.
F<sc>ig</sc>. 4.
Fig. 4.
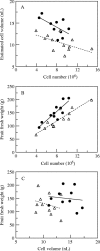
Correlations between (A) cell size and cell number, (B) fruit fresh weight and cell number and (C) fruit fresh weight and cell size. Lines represent linear adjustments. Each point is an individual fruit older than 30 daa sampled at the first position (F1) in the first four trusses of 2F [circles and full line R = −0·60 (A), 0·86 (B), −0·12 (C)] and 5F [triangles and dotted line R = −0·56 (A), 0·87 (B), −0·12 (C)] plants grown at 25/20 °C day/night temperature regime.
F<sc>ig</sc>. 5.
Fig. 5.
Mean C-value of pericarp cells measured in F1 and F2 for 2F treatments (circles) and in fruits F1 and F5 for 5F treatment (triangles). Each point is the mean of three measurements performed on an individual fruit sampled on the first eight trusses of plants grown at 20/20 °C (open circles), 25/25 °C (grey circles) or 25/20 °C (black circles and triangles) day/night temperature. Lines represent three-parameter sigmoid functions fitted on data from each treatment (R2 > 0·84). On the right axis, are indicated the corresponding numbers of incomplete cell cycles.
F<sc>ig</sc>. 6.
Fig. 6.
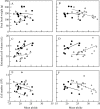
Correlations between mean ploidy of pericarp cells and fruit fresh weight (A and B), cell volume (C and D) and cell number (E and F). Lines represent linear adjustments. Each point is an individual fruit older than 30 daa sampled on the first four trusses at the F1 or F2 positions for the 2F treatments (circles) and at the F1 [open triangles and dotted line R = −0·29 (A), 0·22 (C), −0·29 (E)] or F5 [black triangles and dashed line R = 0·64 (A), 0·69 (C), −0·59 (E)] positions for the 5F treatment. Plants were grown at 20/20 °C [open circles and dotted line R = −0·25 (B), 0·007 (D), −0·33 (F)], 25/25 °C [grey circles and dashed line R = −0·58 (B), 0·54 (D), −0·72 (F)] or 25/20 °C [black circles and full line R = −0·11 (B), 0·66 (D), −0·43 (F) and triangles] day/night temperature.

References

    1. Adams SR, Cockshull KE, Cave CRJ. 2001. Effect of temperature on the growth and development of tomato fruits. Annals of Botany 88: 869–877.
    1. Adams SR, Valdés VM. 2002. The effect of periods of high temperature and manipulating fruit load on the pattern of tomato yields. Journal of Horticultural Science 77: 461–466.
    1. Bangerth F, Ho LC. 1984. Fruit position and fruit set sequence in a truss as factors determining final size of tomato fruits. Annals of Botany 53: 315–319.
    1. Bergervoet JHW, Verhoeven HA, Gilissen LJW, Bino RJ. 1996. High amounts of nuclear DNA in tomato (Lycopersicon esculentum Mill.) pericarp. Plant Science 116: 141–145.
    1. Bertin N, Borel C, Brunel B, Cheniclet C, Causse M. 2003. Do genetic makeup and growth manipulation affect tomato fruit size by cell number, or cell size and DNA endoreduplication? Annals of Botany 92: 415–424. - PMC - PubMed