. 2004 Dec;2(12):e424.
doi: 10.1371/journal.pbio.0020424. Epub 2004 Dec 7.

Algorithmic self-assembly of DNA Sierpinski triangles

Affiliations

Algorithmic self-assembly of DNA Sierpinski triangles

Paul W K Rothemund et al. PLoS Biol. 2004 Dec.

Abstract

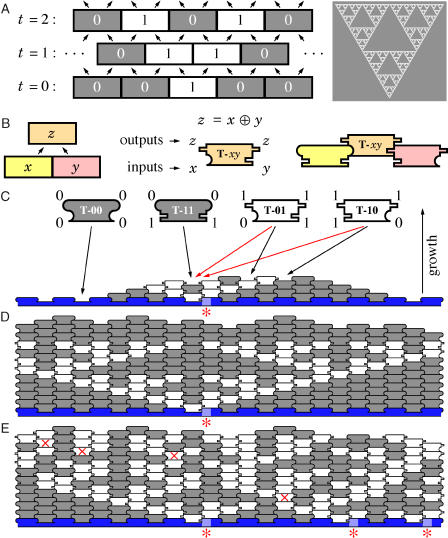
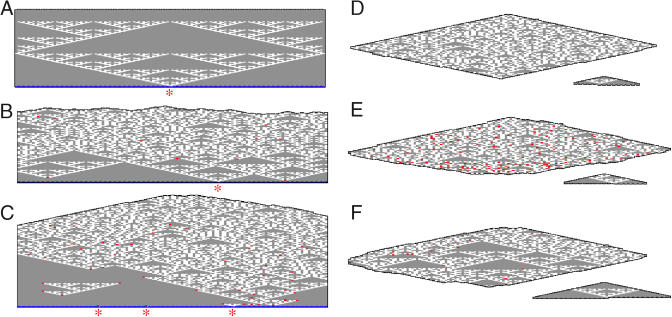
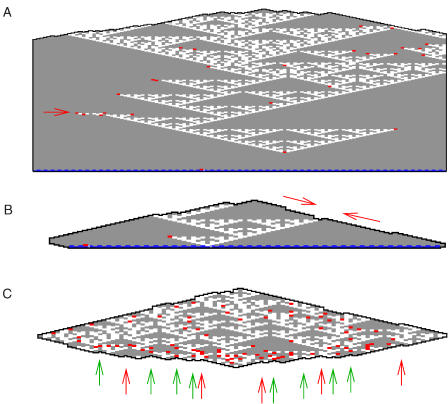
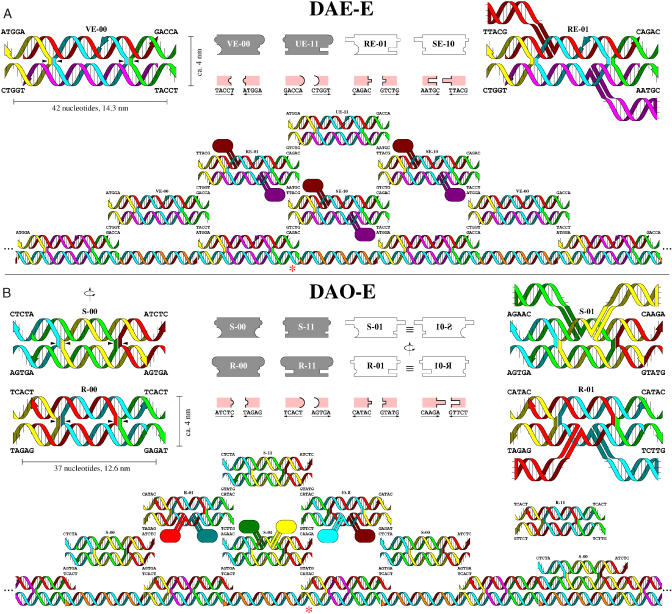
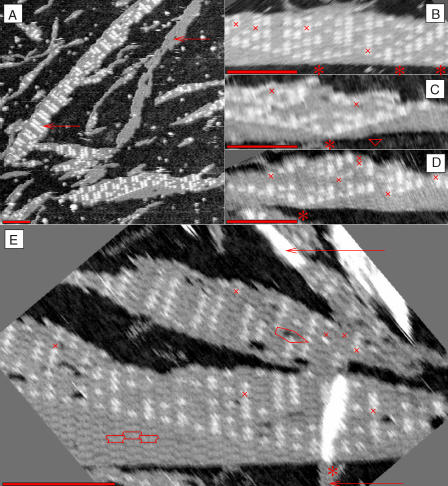
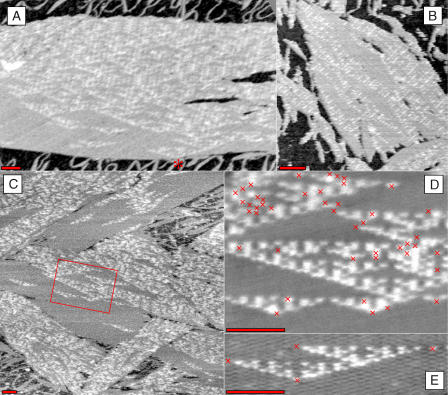
Algorithms and information, fundamental to technological and biological organization, are also an essential aspect of many elementary physical phenomena, such as molecular self-assembly. Here we report the molecular realization, using two-dimensional self-assembly of DNA tiles, of a cellular automaton whose update rule computes the binary function XOR and thus fabricates a fractal pattern--a Sierpinski triangle--as it grows. To achieve this, abstract tiles were translated into DNA tiles based on double-crossover motifs. Serving as input for the computation, long single-stranded DNA molecules were used to nucleate growth of tiles into algorithmic crystals. For both of two independent molecular realizations, atomic force microscopy revealed recognizable Sierpinski triangles containing 100-200 correct tiles. Error rates during assembly appear to range from 1% to 10%. Although imperfect, the growth of Sierpinski triangles demonstrates all the necessary mechanisms for the molecular implementation of arbitrary cellular automata. This shows that engineered DNA self-assembly can be treated as a Turing-universal biomolecular system, capable of implementing any desired algorithm for computation or construction tasks.


Conflict of interest statement

The authors have declared that no conflicts of interest exist.

Figures

Figure 1
Figure 1. The XOR Cellular Automaton and Its Implementation by Tile-Based Self-Assembly
(A) Left: three time steps of its execution drawn as a space–time history. Cells update synchronously according to XOR by the equation shown. Cells at even time steps are interleaved with those at odd time steps; arrows show propagation of information. Right: the Sierpinski triangle. (B) Translating the space–time history into a tiling. For each possible input pair, we generate a tile T-xy that bears the inputs represented as shapes on the lower half of each side and the output as shapes duplicated on the top half of each side. (C) The four Sierpinski rule tiles, T-00, T-11, T-01, and T-10, represent the four entries of the truth table for XOR: 0 ⊕ 0 = 0, 1 ⊕ 1 = 0, 0 ⊕ 1 = 1, and 1 ⊕ 0 = 1. Lower binding domains on the sides of tiles match input from the layer below; upper binding domains provide output to both neighbors on the layer above. Semicircular domains represent ‘0' and rectangular domains, ‘1'. Tiles that output ‘0' (T-00 and T-11) are gray, and we refer to them as ‘0' tiles. Tiles that output ‘1' (T-01 and T-10) are white and are referred to as ‘1' tiles. Initial conditions for the computation are provided by a nucleating structure (blue). Red asterisks indicate sites on the nucleating structure that bear a ‘1' binding domain; elsewhere, sites have all ‘0' binding domains. Black arrows indicate associations that would form two bonds; red arrows, associations that would form one bond. (D) Error-free growth results in the Sierpinski pattern. (E) Error-prone growth from a nucleating structure with three ‘1' domains. Red crosses indicate four mismatch errors.
Figure 2
Figure 2. Typical kTAM Simulation Results
(A) A roughly 130 × 70 subregion of an error-free templated crystal. (B) A subregion with 10 mismatch errors (0.1%), shown in red (both false ‘0's and false ‘1's). Grown at Gmc = 17, Gse = 8.8. Large all-zero patches near the template row are due to intact Sierpinski pattern; for simulations with these parameters, asymptotically only approximately 1% of T-00 tiles are in all-zero patches containing more than 90 tiles (referred to as large patches). (C) A subregion from a crystal grown with the T-00 and T-11 tiles at doubled concentration, on a slowly growing nucleating row. Mismatch errors (43 of them, i.e., 0.3%, during growth at Gmc = 17, Gse = 8.6) characteristically terminate the Sierpinski pattern at corners. Asymptotically, approximately 18% of T-00 tiles are in large patches. (D) An untemplated crystal with roughly 4000 tiles and no errors. Inset: The largest subregion of a perfect Sierpinski pattern is small. (E) An untemplated crystal with several errors, grown at Gmc = 17, Gse = 10.4. Note that growth in the reverse direction is more error-prone. Only approximately 1% of T-00 tiles are in large patches. (F) An untemplated crystal with few errors, grown at Gmc = 17, Gse = 8.6, with T-00 and T-11 at doubled stoichiometry. Note the large perfect subregion. Simulation was initiated by a preformed seed larger than the critical nucleus size (roughly 100 tiles). For these simulation parameters, approximately 25% of T-00 tiles are in large patches. According to the approximations used in Winfree (1998a), Gmc = 17 corresponds to 0.8 μM, Gse = 8.5 corresponds to 41.8 °C, and Gse = 10.4 corresponds to 32.7 °C. The black outline around the crystals is for clarity; it does not represent tiles.
Figure 3
Figure 3. Simulations with Slow Border Growth and T-00 and T-11 at Doubled Concentrations
(A) A common error pattern: termination of triangles at corners. (B) An observed mechanism leading to termination or sideways extension of triangles: preferential nucleation of T-00 on facets. (C) Forward and sideways growth is deterministic: at sites presenting two binding domains, there is always a unique tile that can form exactly two bonds. Backward growth is non-deterministic: at sites where both binding domains agree (e.g., green arrows), there are two possible tiles that can make two bonds (either {T-10, T-01}, or {T-00, T-11}). At sites where the available binding domains disagree (e.g., red arrows), there is no tile that can associate to form two bonds. Since only the output type of tiles are shown, it is impossible to tell from these figures which backward growth sites present agreeing or disagreeing binding domains.
Figure 4
Figure 4. Molecular Schema
(A) Top center: abstract versions of the four DAE-E Sierpinski rule tiles, VE-00, UE-11, RE-01, and SE-10, highlight their differences from the tiles in Figure 1. The arrangement of 3′ and 5′ ends on DAE-E tiles dictates that two distinct pairs of complementary binding domains must be used for each symbol ‘0' or ‘1,' denoted here by making complementary shapes large or small. Pink legends show the mapping of shape to sticky-end sequences. Top left: a molecular diagram for VE-00 shows how each DAE-E tile is comprised of five DNA strands; small arrows point to crossovers. Top right: a diagram for RE-01 shows how hairpins are attached to ‘1' tiles to provide AFM contrast; the exact orientation of these hairpins is unknown. Below: tiles are shown assembling on a nucleating structure. The nucleating strand for the input row (blue) is generated by assembly PCR and frequently reaches lengths of more than 3 μm (200 tiles). The nucleating strand contains subsequences onto which capping strands (orange) and input tile strands assemble to form an input tile outputting ‘0' at random intervals, the nucleating strand contains a subsequence (asterisk) for a different input tile that outputs a ‘1' on one side. (B) Top center: the six DAO-E Sierpinski rule tiles: S-00, R-00, S-11, R-11, S-01, and R-01. Top left and right: molecular diagrams highlight two notable features: (1) R-type tiles output only to S-type tiles, and vice-versa, as dictated by the 3′/5′ polarity of the molecules—again requiring two distinct pairs of binding domains per symbol. (2) The indicated rotational symmetry of the DAO-E molecules allows each molecule to serve in either of two orientations; no explicit S-10 or R-10 tiles are needed. An input tile outputting a single ‘1' sticky end is shown (asterisk). Sequences are given in Figures S4–S7.
Figure 5
Figure 5. AFM Images of DAE-E Crystals
(A) Several frequent morphologies that appear in most samples, including all-'0' (upper arrow) and ‘011011'-striped crystals (lower arrow). The all-'0' crystal may be a tube that opened upon adsorption to the mica. (B) A templated crystal. The identification of tiles in this crystal is given in Figure 1E. Crosses indicate mismatch errors. Asterisks indicate ‘1's on the nucleating strand. (C) A crystal containing 10 rows of error-free Sierpinski triangle. A red triangle marks a lattice defect in the input row. (D) Another Sierpinski triangle, better resolved. (E) A crystal containing a perfect 19 × 6 subregion. Individual tiles can be clearly seen; three tiles are outlined in the lower left. Unfortunately, this crystal landed atop a thin sliver of DNA (lower arrow), obscuring the central columns of the Sierpinski triangle. The upper arrow indicates a 4-tile wide tube, near the point where it opens. A pentagon marks a lattice dislocation. Scale bars are 100 nm.
Figure 6
Figure 6. AFM Images of DAO-E Crystals
(A) A large templated crystal in a 5-tile reaction (no R-11). A single ‘1' in the input row (asterisk) initiates a Sierpinski triangle, which subsequently devolves due to errors. Mismatch errors within ‘0' domains initiate isolated Sierpinski patterns terminated by additional errors at their corners. (B) A large untemplated fragment in a 5-tile reaction (no S-11). Large triangles of ‘0's can be seen. Crystals similar to this are also seen in samples lacking the nucleating structure. (C) Several large crystals in a 6-tile reaction, some with more zeros than ones, some with more ones than zeros. It is difficult to determine whether these crystals are templated or not. (D) An average of several scans of the boxed region from (C), containing roughly 1,000 tiles and 45 errors. (E) An average of several scans of a Sierpinski triangle that initiated by a single error in a sea of zeros and terminated by three further errors (a 1% error rate for the 400 tiles here). Red crosses in (D) and (E) indicate tiles that have been identified (by eye) to be incorrect with respect to the two tiles from which they receive their input. Scale bars are 100 nm.

Comment in

References

    1. Adleman LM. Molecular computation of solutions to combinatorial problems. Science. 1994;266:1021–1024. - PubMed
    1. Adleman LM, Cheng Q, Goel A, Huang MDA. Running time and program size for self-assembled squares. Symposium on Theory of Computing (STOC) New York: Association for Computing Machinery; 2001. pp. 740–748.
    1. Adleman L, Kari J, Kari L, Reishus D. On the decidability of self-assembly of infinite ribbons. Symposium on Foundations of Computer Science (FOCS) New York: Association for Computing Machinery; 2002. pp. 530–537.
    1. Bennett CH. Logical depth and physical complexity. In: Herken R, editor. The universal Turing machine: A half-century survey. Vienna: Springer-Verlag; 1995. pp. 207–235.
    1. Bloomfield VA, Crothers DM, Tinoco I. Nucleic acids: Structures, properties, and functions. Sausalito, California: University Science Books; 2000. 672 pp.

Publication types