

Development of the Monsi-Saeki theory on canopy structure and function
- PMID: 15585544
- PMCID: PMC4246794
- DOI: 10.1093/aob/mci047
Development of the Monsi-Saeki theory on canopy structure and function
Abstract
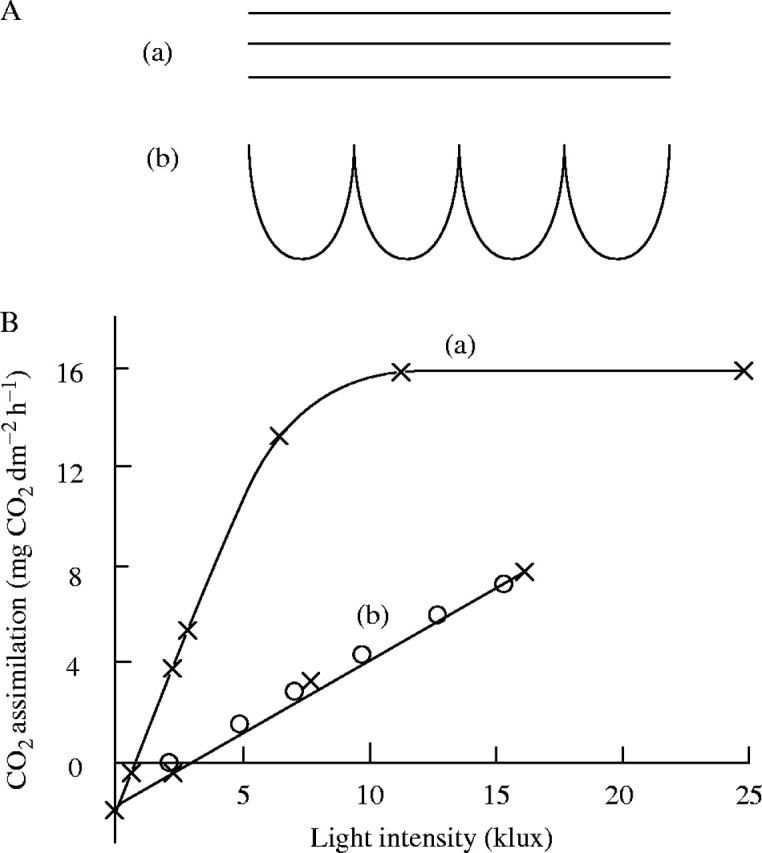
Background and aims: Monsi and Saeki (1953) published the first mathematical model of canopy photosynthesis that was based on the light attenuation within a canopy and a light response of leaf photosynthesis. This paper reviews the evolution and development of their theory.
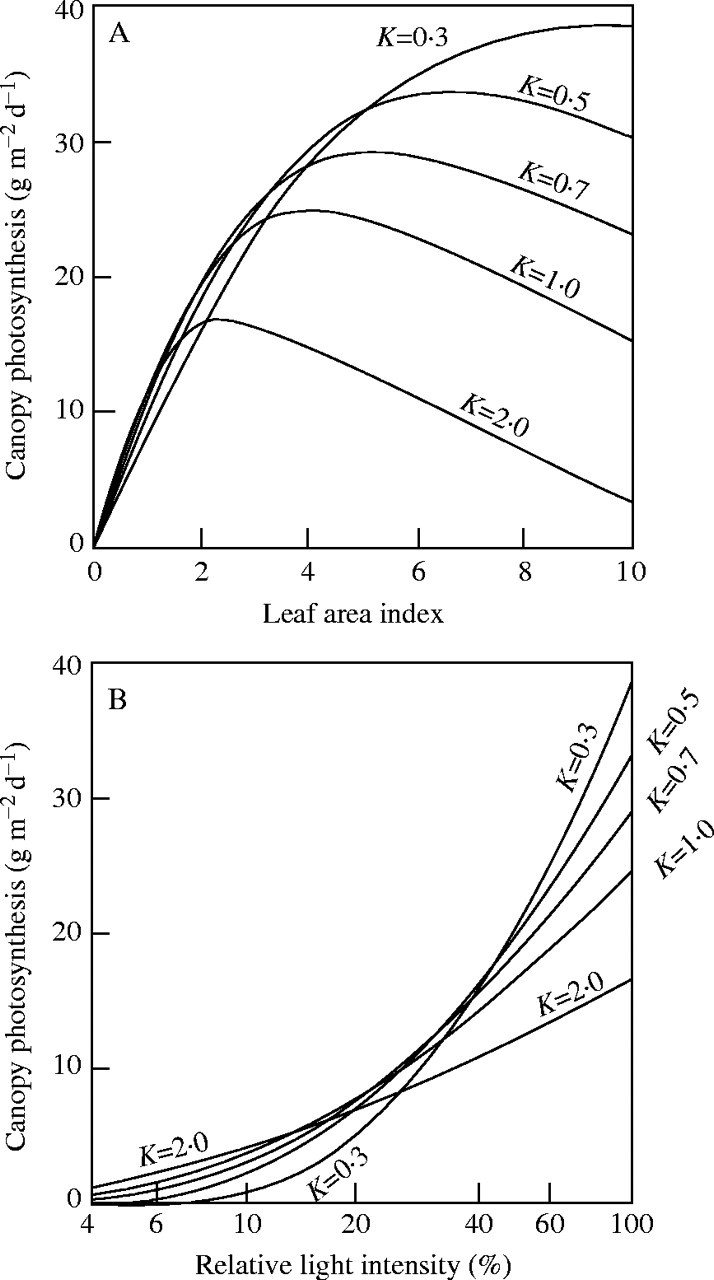
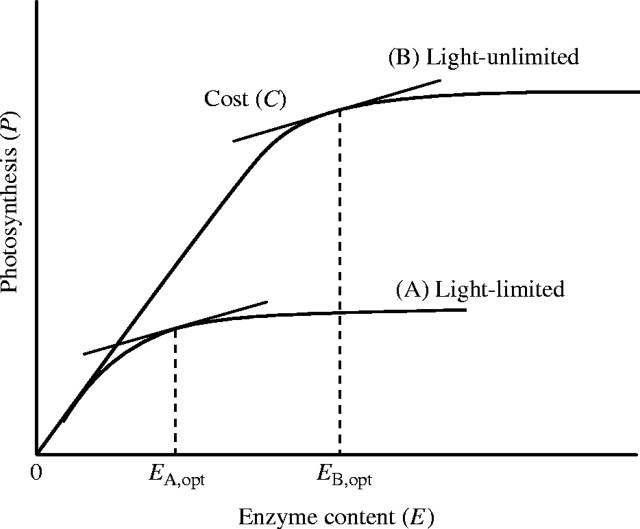
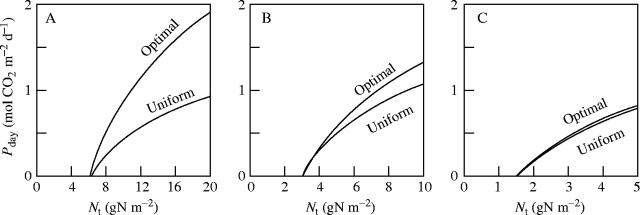
Scope: Monsi and Saeki showed that under full light conditions, canopy photosynthesis is maximized at a high leaf area index (LAI, total leaf area per unit ground area) with vertically inclined leaves, while under low light conditions, it is at a low LAI with horizontal leaves. They suggested that actual plants develop a stand structure to maximize canopy photosynthesis. Combination of the Monsi-Saeki model with the cost-benefit hypothesis in resource use led to a new canopy photosynthesis model, where leaf nitrogen distribution and associated photosynthetic capacity were taken into account. The gradient of leaf nitrogen in a canopy was shown to be a direct response to the gradient of light. This response enables plants to use light and nitrogen efficiently, two resources whose supply is limited in the natural environment.
Conclusion: The canopy photosynthesis model stimulated studies to scale-up from chloroplast biochemistry to canopy carbon gain and to analyse the resource-use strategy of species and individuals growing at different light and nitrogen availabilities. Canopy photosynthesis models are useful to analyse the size structure of populations in plant communities and to predict the structure and function of future terrestrial ecosystems.
Figures
Similar articles
-
Structure and function of plant canopies.Ann Bot. 2005 Feb;95(3):481-2. doi: 10.1093/aob/mci046. Epub 2004 Dec 7. Ann Bot. 2005. PMID: 15661750 Free PMC article.
-
Construction and maintenance of the optimal photosynthetic systems of the leaf, herbaceous plant and tree: an eco-developmental treatise.Ann Bot. 2005 Feb;95(3):507-19. doi: 10.1093/aob/mci049. Epub 2004 Dec 14. Ann Bot. 2005. PMID: 15598701 Free PMC article. Review.
-
A model of dynamics of leaves and nitrogen in a plant canopy: an integration of canopy photosynthesis, leaf life span, and nitrogen use efficiency.Am Nat. 2003 Aug;162(2):149-64. doi: 10.1086/376576. Epub 2003 Jul 16. Am Nat. 2003. PMID: 12858260
-
Evolutionarily stable leaf area production in plant populations.J Theor Biol. 2002 Jul 7;217(1):15-32. doi: 10.1006/jtbi.2002.3022. J Theor Biol. 2002. PMID: 12183127
-
Leaf canopy as a dynamic system: ecophysiology and optimality in leaf turnover.Ann Bot. 2005 Feb;95(3):521-33. doi: 10.1093/aob/mci050. Epub 2004 Dec 7. Ann Bot. 2005. PMID: 15585542 Free PMC article. Review.
Cited by
-
Testing the hypothesis on the relationship between aerodynamic roughness length and albedo using vegetation structure parameters.Int J Biometeorol. 2012 Mar;56(2):411-8. doi: 10.1007/s00484-011-0445-2. Epub 2011 May 12. Int J Biometeorol. 2012. PMID: 21562788
-
Whole-canopy carbon gain as a result of selection on individual performance of ten genotypes of a clonal plant.Oecologia. 2013 Jun;172(2):327-37. doi: 10.1007/s00442-012-2504-8. Epub 2012 Nov 1. Oecologia. 2013. PMID: 23114427
-
Effects of plant density on the aboveground dry matter and radiation-use efficiency of field corn.PLoS One. 2022 Nov 10;17(11):e0277547. doi: 10.1371/journal.pone.0277547. eCollection 2022. PLoS One. 2022. PMID: 36356048 Free PMC article.
-
Cytokinin import rate as a signal for photosynthetic acclimation to canopy light gradients.Plant Physiol. 2007 Apr;143(4):1841-52. doi: 10.1104/pp.106.094631. Epub 2007 Feb 2. Plant Physiol. 2007. PMID: 17277095 Free PMC article.
-
Variation in crown light utilization characteristics among tropical canopy trees.Ann Bot. 2005 Feb;95(3):535-47. doi: 10.1093/aob/mci051. Epub 2004 Dec 7. Ann Bot. 2005. PMID: 15585541 Free PMC article.
References
-
- Ackerly DD. 1992. Light, leaf age and nitrogen concentration in a tropical vine. Oecologia 89: 596–600. - PubMed
-
- Anten NPR, Hikosaka K, Hirose T. 2000. Nitrogen utilisation and the photosynthetic system. In: Marshall B, Roberts JA, eds. Leaf development and canopy growth. Sheffield: Sheffield Academic Press, 171–203.
-
- Anten NPR, Hirose T. 1998. Biomass allocation and light partitioning among dominant and subordinate individuals in Xanthium canadense stands. Annals of Botany 82: 665–673.
-
- Anten NPR, Hirose T. 1999. Interspecific differences in aboveground growth patterns result in spatial and temporal partitioning of light among species in tall-grass meadow. Journal of Ecology 87: 583–597.
