. 2004 Dec 14;101(50):17404-9.
doi: 10.1073/pnas.0408030101. Epub 2004 Dec 7.

Bcl-2-mediated alterations in endoplasmic reticulum Ca2+ analyzed with an improved genetically encoded fluorescent sensor

Affiliations

Bcl-2-mediated alterations in endoplasmic reticulum Ca2+ analyzed with an improved genetically encoded fluorescent sensor

Amy E Palmer et al. Proc Natl Acad Sci U S A. .

Abstract

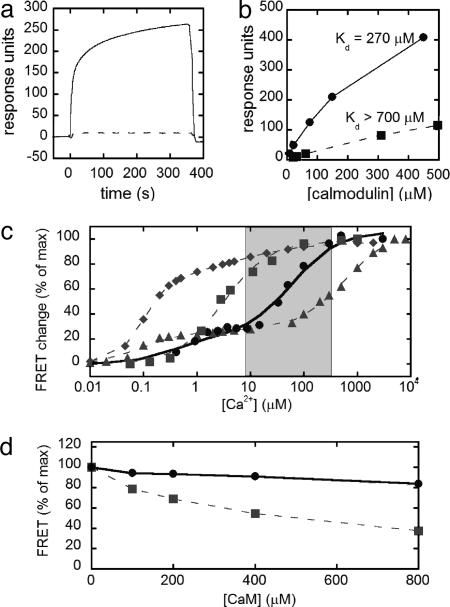
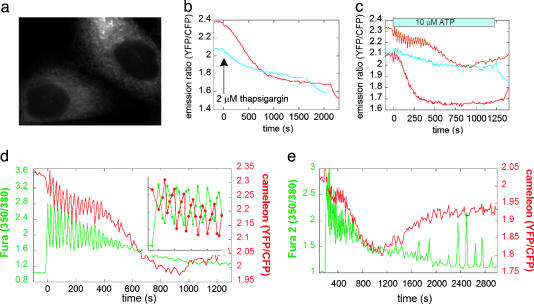
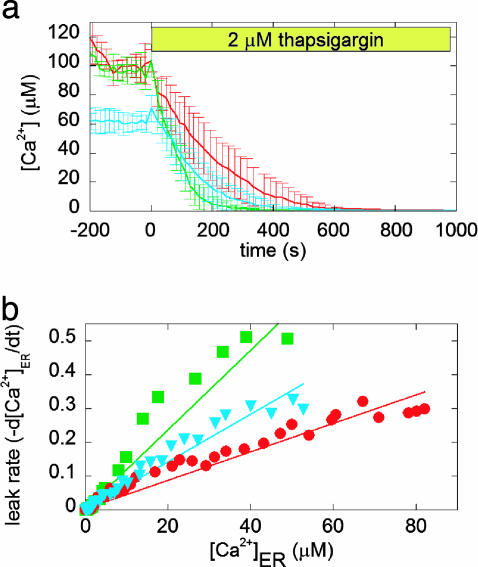
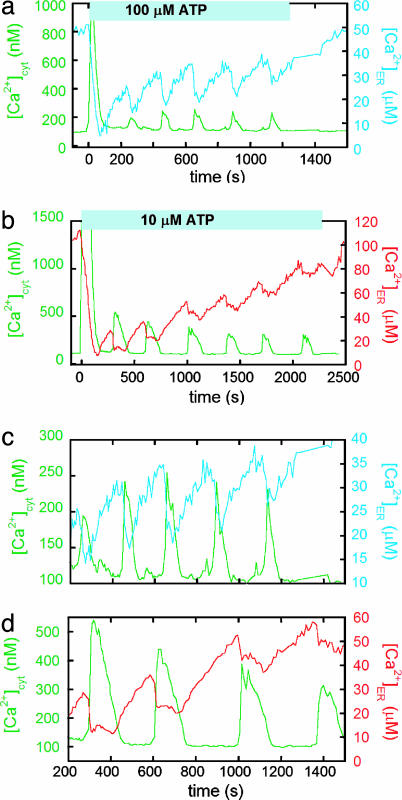
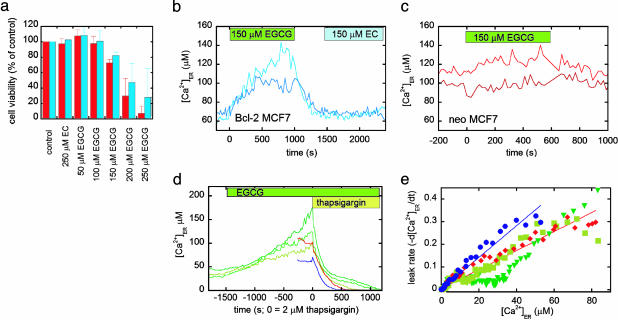
The endoplasmic reticulum (ER) serves as a cellular storehouse for Ca(2+), and Ca(2+) released from the ER plays a role in a host of critical signaling reactions, including exocytosis, contraction, metabolism, regulation of transcription, fertilization, and apoptosis. Given the central role played by the ER, our understanding of these signaling processes could be greatly enhanced by the ability to image [Ca(2+)](ER) directly in individual cells. We created a genetically encoded Ca(2+) indicator by redesigning the binding interface of calmodulin and a calmodulin-binding peptide. The sensor has improved reaction kinetics and a K(d) ideal for imaging Ca(2+) in the ER and is no longer perturbed by large excesses of native calmodulin. Importantly, it provides a significant improvement over all previous methods for monitoring [Ca(2+)](ER) and has been used to directly show that, in MCF-7 breast cancer cells, the antiapoptotic protein B cell lymphoma 2 (Bcl-2) (i) lowers [Ca(2+)](ER) by increasing Ca(2+) leakage under resting conditions and (ii) alters Ca(2+) oscillations induced by ATP, and that acute inhibition of Bcl-2 by the green tea compound epigallocatechin gallate results in an increase in [Ca(2+)](ER) due to inhibition of Bcl-2-mediated Ca(2+) leakage.


Figures

Fig. 1.
Fig. 1.
In vitro characterization of the mutant CaM and peptide and the resulting redesigned cameleon. (a) Biacore sensorgram of WT CaM binding to skMLCK (solid line) and four-charge reversal skMLCK (dashed line). CaM was injected over the surface in the presence of saturating Ca2+ starting at time t = 0 for 360 s. (b) Binding of WT (squares, dashed line) and mutant (circles, solid line) CaM to mutant skMLCK with four-charge reversals. The binding of CaM reached a steady state during the association phase, and therefore a Scatchard analysis was used to determine the dissociation constants (Fig. 8). (c) In vitro calcium titration curves of YC2.1 (diamonds, dashed line), YC3.3 (squares, dashed line), YC4.3 (triangles, dashed line), and D1 (circles, solid line), along with corresponding fits of the data. The gray box represents the typical range of [Ca2+] in the ER, from resting to the depleted state. (d) Percent of the maximum FRET response of YC3.3 (squares) and D1 (circles) with increasing concentrations of WT CaM.
Fig. 2.
Fig. 2.
Comparison of the response of ER-targeted YC4.3 and D1 in HeLa cells. (a) Fluorescence image of D1ER in HeLa cells showing effective ER localization. (b) Emission ratio of D1 (red) and YC4.3 (blue) in the ER upon treatment with thapsigargin. (c) Emission ratio of D1 (red lines, representing two different cells) and YC4.3 (blue) in the ER upon treatment with ATP. (d) Simultaneous imaging of Ca2+ in the cytosol (using fura-2, green) and ER (D1, red). The left axis represents the excitation ratio of fura-2 (350/380 nm), and the right axis represents the emission ratio of the cameleon (citrine/CFP). (e) Same experimental conditions as in d but for an extended amount of time. In the continued presence of 10 μM ATP, the ER begins to refill with Ca2+ after ∼1,000 s.
Fig. 3.
Fig. 3.
The effect of Bcl-2 overexpression on the [Ca2+]ER of MCF-7 cells. (a) Comparison of [Ca2+]ER in neo (red), Bcl-2 (blue), and Bcl-2 also overexpressing SERCA2b (green) cells. Each trace represents the average of more than five cells. Emission ratios were converted into [Ca2+], as described in Materials and Methods. Thapsigargin was added at time t = 0 in the absence of external Ca2+ to prevent Ca2+ influx due to capacitative Ca2+ entry. (b) Leakage rate of Ca2+ from the ER as a function of [Ca2+]ER for Bcl-2 (blue), neo (red), and Bcl-2 overexpressing SERCA2b (green) cells.
Fig. 4.
Fig. 4.
Comparison between ATP-induced Ca2+ oscillations in the cytosol and the ER for Bcl-2 and neo MCF-7 cells. The differences between Bcl-2 (a and c) and neo (b and d) cells are highlighted in c and d, which are on the same timescale and focus on the oscillations induced by ATP. The [Ca2+]cyt signal is in green, and the [Ca2+]ER signal is in blue for Bcl-2 and red for neo cells. The fura-2 excitation ratio (350/380 nm) and cameleon emission ratio (citrine/CFP) were converted to [Ca2+], as outlined in Materials and Methods.
Fig. 5.
Fig. 5.
The effect of the green tea compound EGCG and a control compound EC on apoptosis and [Ca2+]ER of MCF-7 cells. (a) Cell viability (percent of the control), as determined by FACS analysis of propidium iodide and annexin V-stained neo (red) and Bcl-2 (blue) cells after 48-h treatment with nothing (control), EC, and increasing concentrations of EGCG. (b) Treatment of MCF-7 cells overexpressing Bcl-2 with EGCG and EC, as denoted by the green and blue boxes. The traces represent two different cells. (c) Treatment of MCF-7 neo cells with EGCG, as denoted by the green box. The traces represent two different cells. It should be noted that EC did not cause an increase in [Ca2+]ER in neo cells. (d) Bcl-2 cells treated with EGCG (green traces, each representing an individual cell) compared with neo (red) and Bcl-2 (blue) cells. At time t = 0, cells were treated with 2 μM thapsigargin in the absence of external Ca2+ to determine the ER Ca2+ leakage rate. (e) Comparison of the leakage rates of Ca2+ from the ER for Bcl-2 (blue circles), neo (red diamonds), and Bcl-2 cells pretreated with EGCG (green, upside-down triangles and squares), showing the decreased leakage rate upon EGCG treatment.

References

    1. Alvarez, J. & Montero, M. (2002) Cell Calcium 32, 251–260. - PubMed
    1. Solovyova, N. & Verkhratsky, A. (2002) J. Neurosci. Methods 122, 1–12. - PubMed
    1. Sneyd, J., Tsaneva-Atanasova, K., Yule, D. I., Thompson, J. L. & Shuttleworth, T. J. (2004) Proc. Natl. Acad. Sci. USA 101, 1392–1396. - PMC - PubMed
    1. Arnaudeau, S., Kelley, W. L., Walsh, J. V., Jr., & Demaurex, N. (2001) J. Biol. Chem. 276, 29430–29439. - PubMed
    1. Filippin, L., Magalhaes, P. J., Benedetto, G. D., Colella, M. & Pozzan, T. (2003) J. Biol. Chem. 278, 39224–39234. - PubMed

Publication types

MeSH terms

Associated data