. 2004 Dec 21;101(51):17849-54.
doi: 10.1073/pnas.0403504101. Epub 2004 Dec 7.

Control of a two-dimensional movement signal by a noninvasive brain-computer interface in humans

Affiliations

Control of a two-dimensional movement signal by a noninvasive brain-computer interface in humans

Jonathan R Wolpaw et al. Proc Natl Acad Sci U S A. .

Abstract

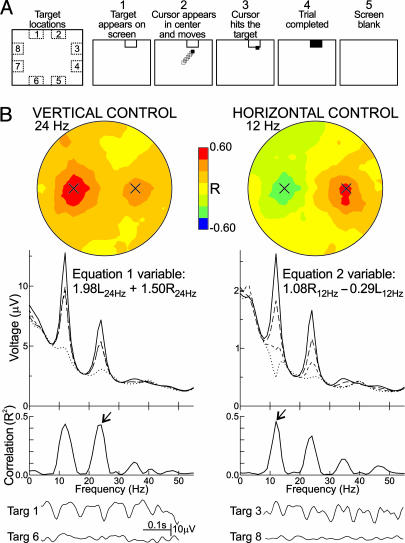
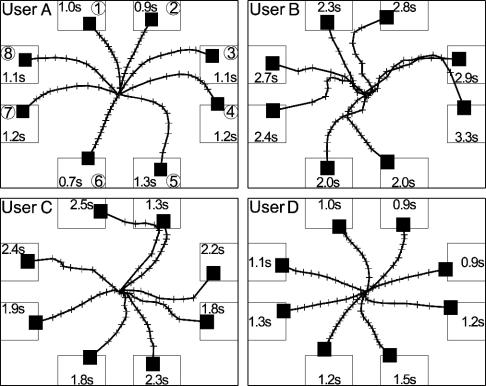
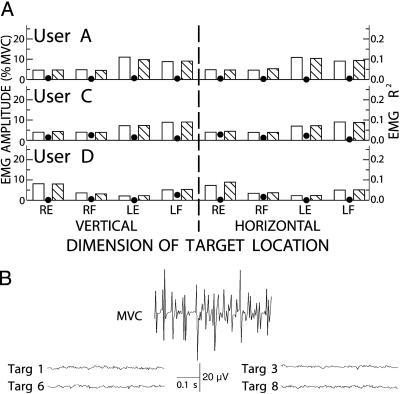
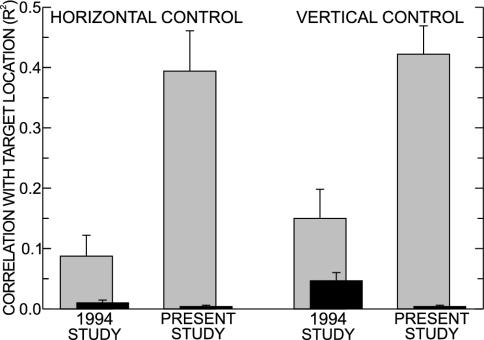
Brain-computer interfaces (BCIs) can provide communication and control to people who are totally paralyzed. BCIs can use noninvasive or invasive methods for recording the brain signals that convey the user's commands. Whereas noninvasive BCIs are already in use for simple applications, it has been widely assumed that only invasive BCIs, which use electrodes implanted in the brain, can provide multidimensional movement control of a robotic arm or a neuroprosthesis. We now show that a noninvasive BCI that uses scalp-recorded electroencephalographic activity and an adaptive algorithm can provide humans, including people with spinal cord injuries, with multidimensional point-to-point movement control that falls within the range of that reported with invasive methods in monkeys. In movement time, precision, and accuracy, the results are comparable to those with invasive BCIs. The adaptive algorithm used in this noninvasive BCI identifies and focuses on the electroencephalographic features that the person is best able to control and encourages further improvement in that control. The results suggest that people with severe motor disabilities could use brain signals to operate a robotic arm or a neuroprosthesis without needing to have electrodes implanted in their brains.


Figures

Fig. 1.
Fig. 1.
The protocol and the EEG control it achieves. (A) Protocol. The screen at Left shows the eight possible target locations. The other screens show the sequence of events in one trial. 1, a target appears; 2, 1 s later the cursor appears and moves in two dimensions controlled by the user's EEG activity as described in Methods; 3, the cursor reaches the target; 4, the target flashes for 1 s; 5, the screen is blank for 1 s and then the next trial begins. (Step 2 lasts up to 10 s. If the cursor does not reach the target in this time, the trial jumps to step 5.) (B) Topographical and spectral properties of user A's EEG control. In this user, vertical movement was controlled by a 24-Hz beta rhythm and horizontal movement by a 12-Hz mu rhythm. (Top) Scalp topographies (nose at top) of the correlations of the 24-Hz and 12-Hz rhythms with vertical and horizontal target levels, respectively. The sites of the left- and right-side scalp electrodes [locations C3 and C4 over sensorimotor cortex (21)] that controlled the cursor are marked. Vertical correlation is greater on the left side, whereas horizontal correlation is greater on the right side. The topographies are for R rather than R2 to show the opposite (i.e., positive and negative, respectively) correlations of right and left sides with horizontal target level. (Middle) Voltage spectra (i.e., the weighted combinations of right-side and left-side spectra) from which were derived the vertical and horizontal variables and their corresponding R2 spectra. Voltage spectra are shown for the four vertical target levels [targets 1 and 2 (solid), 3 and 8 (long dash), 4 and 7 (short dash), and 5 and 6 (dotted)] and for the four horizontal target levels [targets 3 and 4 (solid), 2 and 5 (long dash), 1 and 6 (short dash), and 7 and 8 (dotted)], respectively. For the R2 spectra, the arrows point to the frequency bands used for the vertical and horizontal variables, respectively. (Bottom) Samples of EEG activity from single trials. On the Left are traces from electrode C3 (i.e., the major contributor to the vertical variable) for trials in which the target was at the top (target 1 in Fig. 1 A) or bottom (target 6) screen edge. On the Right are traces from electrode C4 (the major contributor to the horizontal variable) for trials in which the target was at the right (target 3) or left (target 8) edge. They illustrate the sensorimotor rhythm control that enabled the user to move the cursor to the target.
Fig. 2.
Fig. 2.
Cursor trajectories. Each user's average cursor path to each target for all trials in which the cursor reached the target within 2 s for user A, 5 s for user B, 4 s for user C, and 2 s for user D (i.e., the fastest 53-75% of the user's target hits, so as to best reveal the movement path and timing). Each path is divided by crosses into tenths of the time taken to reach the target, and the average time is shown in the target. The circled numbers are the target locations as in Fig. 1 A. A video of user A's real-time performance is shown in Movie 1.
Fig. 3.
Fig. 3.
EMG activity during cursor control. (A) EMG amplitudes [in percent of maximum voluntary contraction (MVC)] during cursor movement for each direction (top or left, open bars; bottom or right, hatched bars) of each dimension (vertical or horizontal) of target location and its corresponding R2 value (filled circle) for right and left forearm flexor (RF and LF) and extensor (RE and LE) muscle groups of users A, B, and D. EMG amplitudes are low, and (as the R2 values show) EMG is not correlated with target direction in either dimension of target location. (B) Samples of right forearm extensor EMG activity from user D. The top trace shows a MVC. The other traces are from trials in which the target was at the top (Fig. 1 A, target 1), bottom (target 6), right (target 3), or left (target 8) screen edge. As they illustrate, EMG activity during cursor control was very low and was not correlated with target location.
Fig. 4.
Fig. 4.
Comparison with previous noninvasive control. Average (±SE) correlations (measured as R2) between the vertical and horizontal variables and the vertical and horizontal dimensions of target location for our initial (1994) study of multidimensional EEG control (24) and for the present study. Gray bars, correlations with the appropriate dimension of target location; black bars, correlations with the inappropriate dimension. The present study achieves much higher correlations with the appropriate dimension and avoids correlations with the inappropriate dimension. The R2 values of the 1994 study (24) are from its table 1 (i.e., average R2 for the appropriate dimension for the four users who achieved two-dimensional control) and its figure 3 (i.e., average R2 for the inappropriate dimension. The R2 values for the present study are averages from Table 1.

References

    1. Wolpaw, J. R., Birbaumer, N., McFarland, D. J., Pfurtscheller, G. & Vaughan, T. M. (2002) Clin. Neurophysiol. 113, 767-791. - PubMed
    1. Birbaumer, N., Ghanayim, N., Hinterberger, T., Iversen, I., Kotchoubey, B., Kübler, A., Perelmouter, J., Taub, E. & Flor, H. (1999) Nature 398, 297-298. - PubMed
    1. Pfurtscheller, G., Neuper, C., Müller, G. R., Obermaier, B., Krausz, G., Schlögl, A., Scherer, R., Graimann, B., Keinrath, C., Skliris, D., et al. (2003) IEEE Trans. Neural Syst. Rehabil. Eng. 11, 177-180. - PubMed
    1. Chapin, J. K., Moxon, K. A., Markowitz, R. S. & Nicolelis, M. A. L. (1999) Nat. Neurosci. 2, 664-670. - PubMed
    1. Wessberg, J., Stambaugh, C. R., Kralik, J., Beck, P. D., Laubach, M., Chapin, J. K., Kim, J., Biggs, J., Srinivasan, M. A. & Nicolelis, M. A. (2000) Nature 408, 361-365. - PubMed

Publication types