. 2004 Dec 7;32(21):6414-24.
doi: 10.1093/nar/gkh978. Print 2004.

Global protein function annotation through mining genome-scale data in yeast Saccharomyces cerevisiae

Affiliations

Global protein function annotation through mining genome-scale data in yeast Saccharomyces cerevisiae

Yu Chen et al. Nucleic Acids Res. .

Abstract

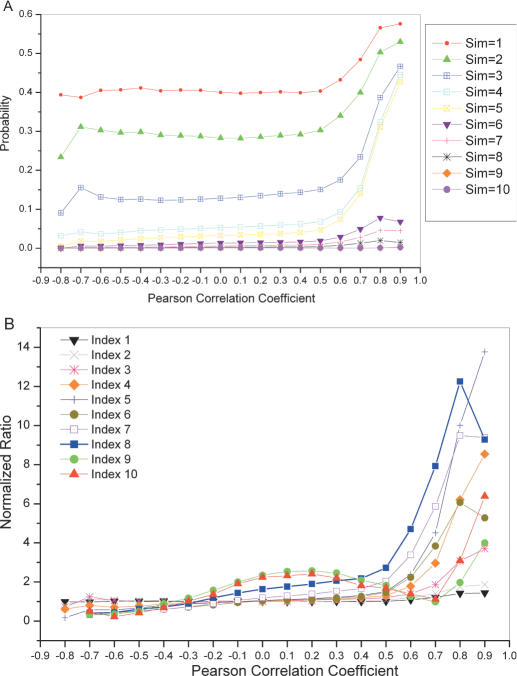
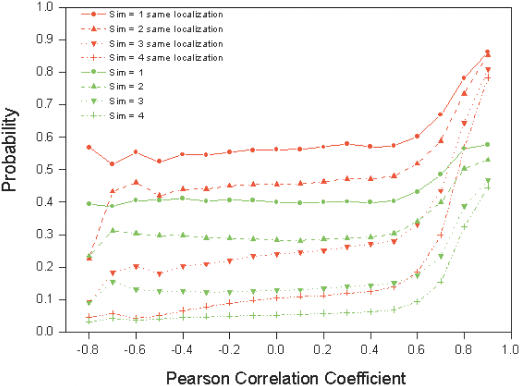
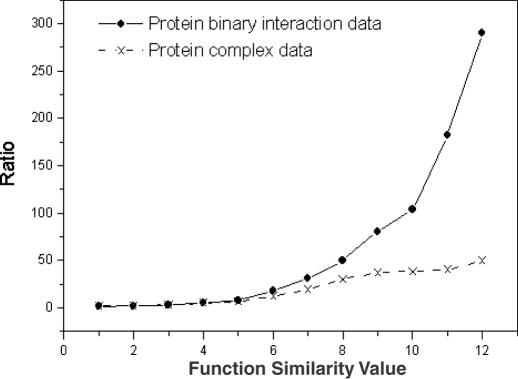
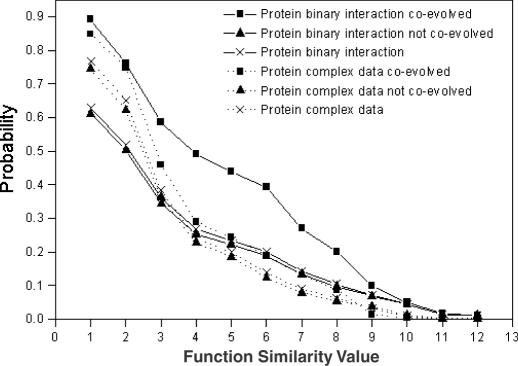
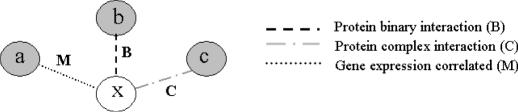
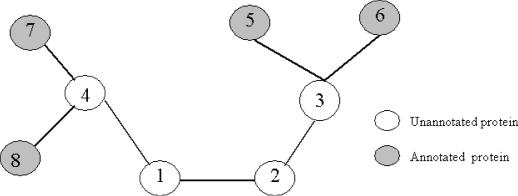
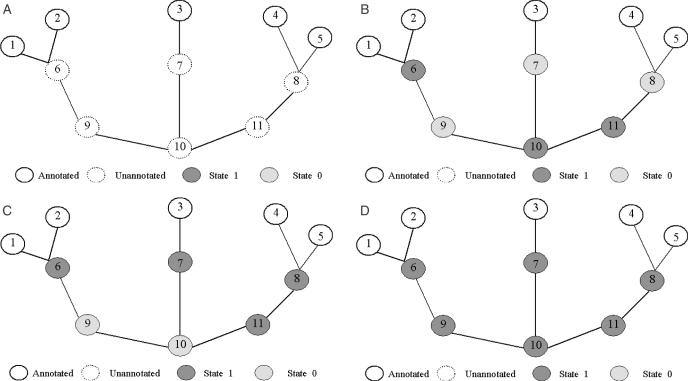
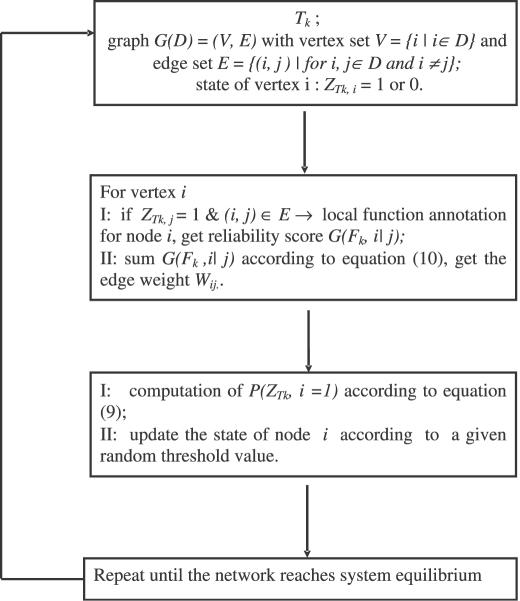
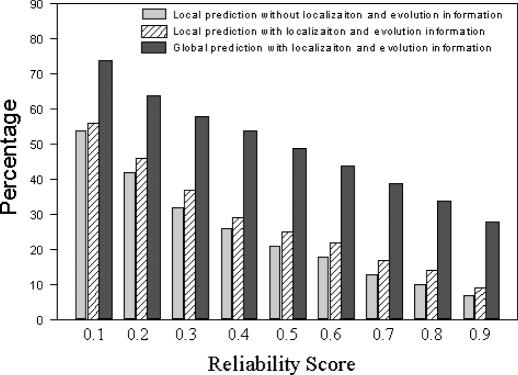
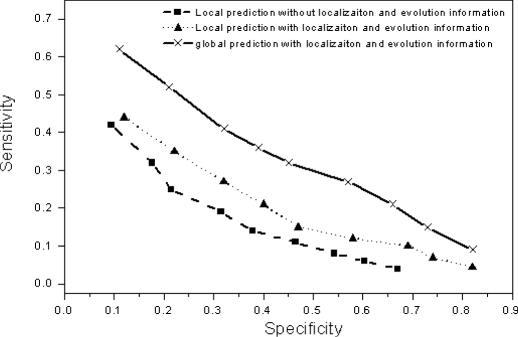
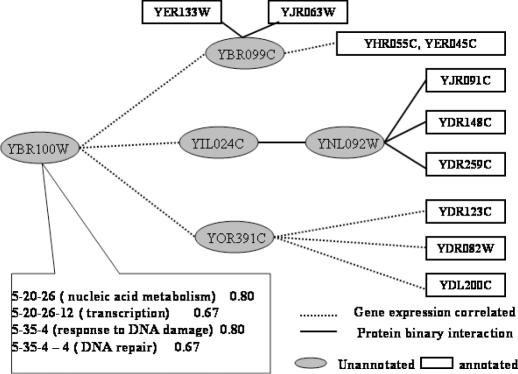
As we are moving into the post genome-sequencing era, various high-throughput experimental techniques have been developed to characterize biological systems on the genomic scale. Discovering new biological knowledge from the high-throughput biological data is a major challenge to bioinformatics today. To address this challenge, we developed a Bayesian statistical method together with Boltzmann machine and simulated annealing for protein functional annotation in the yeast Saccharomyces cerevisiae through integrating various high-throughput biological data, including yeast two-hybrid data, protein complexes and microarray gene expression profiles. In our approach, we quantified the relationship between functional similarity and high-throughput data, and coded the relationship into 'functional linkage graph', where each node represents one protein and the weight of each edge is characterized by the Bayesian probability of function similarity between two proteins. We also integrated the evolution information and protein subcellular localization information into the prediction. Based on our method, 1802 out of 2280 unannotated proteins in yeast were assigned functions systematically.


Figures

Figure 1
Figure 1
(A) Probabilities of pairs sharing the same levels of GO indices versus Pearson correlation coefficient of microarray gene expression profiles. (B) Normalized ratios for the probabilities of gene pairs sharing the same levels of GO indices (p(S|Mr)) against the probabilities of random gene pairs sharing the same levels function similarity (p(S)) versus Pearson correlation coefficient of microarray gene expression profiles.
Figure 2
Figure 2
Probabilities of sharing the same function calculated from the gene pairs with the same localization (red lines) and from all the gene pairs without localization information considered (green lines) versus Pearson correlation coefficient of microarray gene expression profiles.
Figure 3
Figure 3
Functional relationship in yeast protein–protein interaction data. The horizontal axis shows the GO INDEX levels that two proteins share. The normalized ratios between the probabilities of interacting proteins sharing the same levels of GO INDICES compared with the probabilities of random pairs are shown in vertical axis.
Figure 4
Figure 4
The probabilities of sharing the same function for interaction pairs that are co-evolved (line with square), interaction pairs that are not co-evolved (line with up triangle) and overall interaction pairs (line with cross). The solid lines are for protein binary interaction data and dot lines are for protein complex interaction data.
Figure 5
Figure 5
Illustration of prediction method. Protein x is an unannotated protein. Proteins a, b and c are all the proteins with known functions that have interaction with protein x. The interaction events could be correlation in gene expression (M), protein binary interaction (B) or protein complex interaction (C).
Figure 6
Figure 6
Illustration of protein function global prediction from interaction network. Proteins 1, 2, 3 and 4 are unannotated proteins. Proteins 5, 6, 7 and 8 are annotated proteins with known functions.
Figure 7
Figure 7
Illustration of the global method for function prediction using simulated annealing technique. (A) A given interaction network where proteins (1–5) have known function and proteins (6–11) are unannotated proteins. (B) In the initial state, the states of all unannotated proteins (nodes) are randomly selected to be 0 or 1 and the state of any annotated protein is always 1. For the unannotated protein with assigned state as 1, its functions are predicted using the local prediction method. (C) Starting with a high temperature, for each node i we compute its value μi, then update its state. Thus proteins 6, 7, 8, 11 can be assigned function. This process is shown in Figure 8. (D) With temperature going down, all unannotated proteins might be assigned function finally. The system might resettle in a global optimization of network configuration.
Figure 8
Figure 8
The flow chart of dynamical process of protein functional prediction and state updating in an interaction network.
Figure 9
Figure 9
Percentage of proteins in testing data whose functions can be successfully predicted versus the Reliability score, with an interval of 0.1. The percentage is calculated as P = n/N where n is the number of proteins whose functions are correctly predicted, and N is the number of predictable proteins for their functions by the method. For local prediction method N = 0.84 × (number of testing proteins) and for the global prediction method N = 0.87 × (number of testing proteins).
Figure 10
Figure 10
Sensitivity–specificity plot on the test set for the three prediction methods.
Figure 11
Figure 11
Global function prediction for yeast YBR100W. All interacting partners of YBR100W are unknown in functions. Through the global prediction method, it was assigned to several functions GO Indices. The functions of related proteins are shown in Table 5.

References

    1. Goffeau A., Barrell,B.G., Bussey,H., Davis,R.W., Dujon,B., Feldmann,H., Galibert,F., Hoheisel,J.D., Jacq,C., Johnston,M., Louis,E.J, Mewes,H.W., Murakami,Y., Philippsen,P., Tettelin,H. and Oliver,S.G. (1996) Life with 6000 genes. Science, 546, 346–352. - PubMed
    1. Pearson W. and Lipman,D. (1998) Improved tools for biological sequence comparison. Proc. Natl Acad. Sci. USA, 85, 2444–2448. - PMC - PubMed
    1. Altschul S., Madden,T., Schaffer,A., Zhang,J., Zhang,Z., Miller,W. and Lipman,D. (1997) Gapped BLAST and PSI-BLAST: a new generation of protein database search programs. Nucleic Acids Res., 25, 3389–3402. - PMC - PubMed
    1. Marcotte E., Pellegrini,M., Thompson,M., Yeates,T. and Eisenberg,D. (1999) A combined algorithm for genome-wide prediction of protein function. Nature, 402, 83–86. - PubMed
    1. Pellegrini M., Marcotte,E., Thompson,M., Eisenberg,D. and Yeates,T. (1999) Assigning protein functions by comparative genome analysis: protein phylogenetic profiles. Proc. Natl Acad. Sci. USA, 96, 4285–4288. - PMC - PubMed

Publication types

MeSH terms

Substances