Comparative Study
. 2004 Dec 9:5:194.
doi: 10.1186/1471-2105-5-194.

Optimized LOWESS normalization parameter selection for DNA microarray data

Affiliations
Comparative Study

Optimized LOWESS normalization parameter selection for DNA microarray data

John A Berger et al. BMC Bioinformatics. .

Abstract

Background: Microarray data normalization is an important step for obtaining data that are reliable and usable for subsequent analysis. One of the most commonly utilized normalization techniques is the locally weighted scatterplot smoothing (LOWESS) algorithm. However, a much overlooked concern with the LOWESS normalization strategy deals with choosing the appropriate parameters. Parameters are usually chosen arbitrarily, which may reduce the efficiency of the normalization and result in non-optimally normalized data. Thus, there is a need to explore LOWESS parameter selection in greater detail.

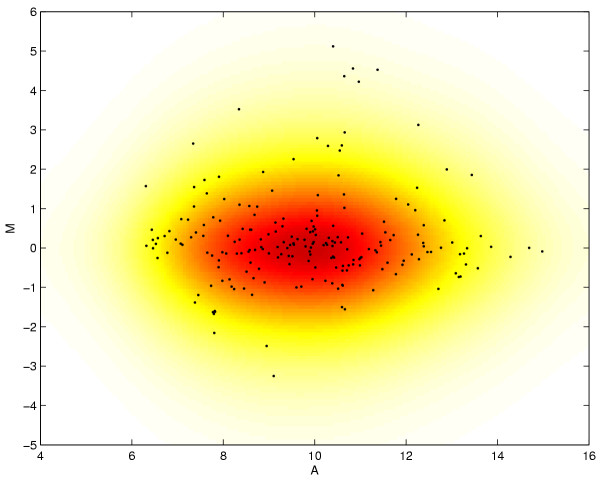
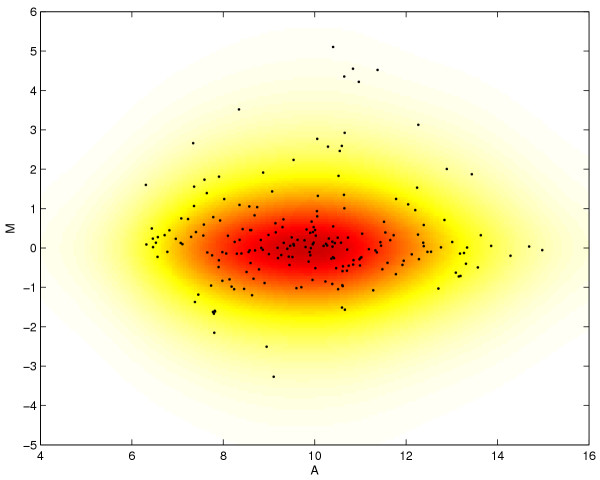
Results and discussion: In this work, we discuss how to choose parameters for the LOWESS method. Moreover, we present an optimization approach for obtaining the fraction of data points utilized in the local regression and analyze results for local print-tip normalization. The optimization procedure determines the bandwidth parameter for the local regression by minimizing a cost function that represents the mean-squared difference between the LOWESS estimates and the normalization reference level. We demonstrate the utility of the systematic parameter selection using two publicly available data sets. The first data set consists of three self versus self hybridizations, which allow for a quantitative study of the optimization method. The second data set contains a collection of DNA microarray data from a breast cancer study utilizing four breast cancer cell lines. Our results show that different parameter choices for the bandwidth window yield dramatically different calibration results in both studies.

Conclusions: Results derived from the self versus self experiment indicate that the proposed optimization approach is a plausible solution for estimating the LOWESS parameters, while results from the breast cancer experiment show that the optimization procedure is readily applicable to real-life microarray data normalization. In summary, the systematic approach to obtain critical parameters in the LOWESS technique is likely to produce data that optimally meets assumptions made in the data preprocessing step and thereby makes studies utilizing the LOWESS method unambiguous and easier to repeat.


Figures

Figure 1
Figure 1
(M(Arb), M(Opt))-Scatterplot analysis of BT-474 self versus self data This plot compares the calibrated ratios obtained by LOWESS (d = 1) with the arbitrary choice of fk = 0.4 for all print-tips compared to ratios obtained with optimized fk for each print-tip group. The line of unity slope that passes through the origin shows where all the points should lay if both calibration methods produced identical ratios. For this self versus self experiment, the group of points that lay under this line shows that the arbitrary fk may improperly under-normalize these points.
Figure 2
Figure 2
(M(Arb), M(Opt))-Scatterplot analysis of BT-474_01 data This plot compares the calibrated ratios obtained by LOWESS (d = 1) with arbitrary (fk = 0.2) and optimized bandwidth windows for the first replicate hybridization of the BT-474 breast cancer cell line. Again, the line of unity slope shows where all the points should lay if both calibration methods produced identically calibrated ratios. Many points deviate from the similarity line in this example and such results are commonly observed for the microarray data used in this study. Consequently, it is clear that the choice of fk greatly affects how the data is calibrated. Points that are furthest away from the similarity line are highly influenced by the choice of fk in LOWESS calibration.
Figure 3
Figure 3
Print-tip LOWESS comparisons for BT-474_01 data This (A, M)-scatterplot shows a two-dimensional histogram [33] or all the spots for the first replicate BT-474 breast cancer hybridization, where the bright red color indicates a high concentration of spots. Print-tip k = 16 is highlighted by black dots. The LOWESS estimates obtained by using f16 = 0.2 are shown by the dark blue line and the estimates using optimal f16 is shown here in light blue. This result is typical for the print-tips in this study based on minimizing the cost function given in Eq. (5).
Figure 4
Figure 4
Arbitrary calibration results for BT-474_01 data All spots are shown using a two-dimensional scatterplot with the spots from print-tip k = 16 are highlighted here in black. LOWESS calibration has been performed using the choice of fk = 0.2 for all print-tips.
Figure 5
Figure 5
Optimized calibration results for BT-474_01 data This scatterplot shows LOWESS calibration after optimized choices of fk have been obtained for all print-tips. Compared to the results in Figure 4, the normalized data here has less overall variance. In addition, genes that have been verified experimentally conform in better agreement with the well-known biology.

References

    1. Schena M, Shalon D, Davis RW, Brown PO. Quantitative monitoring of gene expression patterns with a complementary DNA microarray. Science. 1995;270:467–470. - PubMed
    1. Goryachev AB, MacGregor PF, Edwards AM. Unfolding of microarray data. Journal of Computational Biology. 2001;8:443–461. doi: 10.1089/106652701752236232. - DOI - PubMed
    1. Ideker T, Thorsson V, Siegel AF, Hood LE. Testing for differentially-expressed genes by maximum-likelihood analysis of microarray data. Journal of Computational Biology. 2000;7:805–817. doi: 10.1089/10665270050514945. - DOI - PubMed
    1. Kerr MK, Martin M, Churchill GA. Analysis of variance for gene expression microarray data. Journal of Computational Biology. 2000;7:819–837. doi: 10.1089/10665270050514954. - DOI - PubMed
    1. Tseng GC, Oh MK, Rohlin L, Liao JC, Wong WH. Issues in cDNA microarray analysis: quality filtering, channel normalization, models of variations and assessment of gene effects. Nucleic Acids Research. 2001;29:2549–2557. doi: 10.1093/nar/29.12.2549. - DOI - PMC - PubMed

Publication types

MeSH terms