Comparative Study
. 2004 Dec 9:5:193.
doi: 10.1186/1471-2105-5-193.

Comparing functional annotation analyses with Catmap

Affiliations
Comparative Study

Comparing functional annotation analyses with Catmap

Thomas Breslin et al. BMC Bioinformatics. .

Abstract

Background: Ranked gene lists from microarray experiments are usually analysed by assigning significance to predefined gene categories, e.g., based on functional annotations. Tools performing such analyses are often restricted to a category score based on a cutoff in the ranked list and a significance calculation based on random gene permutations as null hypothesis.

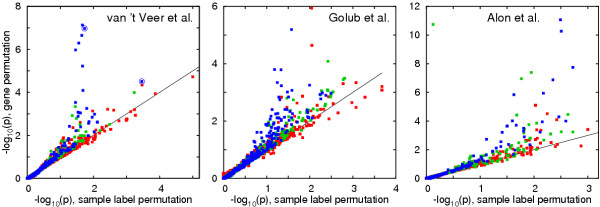
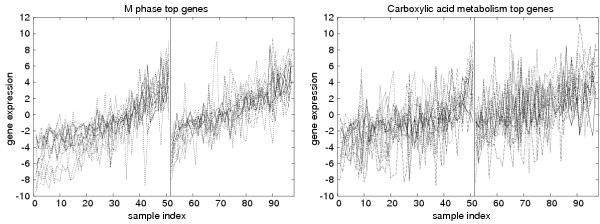
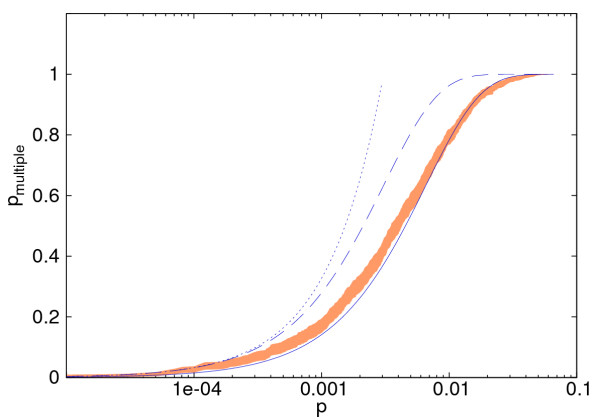
Results: We analysed three publicly available data sets, in each of which samples were divided in two classes and genes ranked according to their correlation to class labels. We developed a program, Catmap (available for download at http://bioinfo.thep.lu.se/Catmap), to compare different scores and null hypotheses in gene category analysis, using Gene Ontology annotations for category definition. When a cutoff-based score was used, results depended strongly on the choice of cutoff, introducing an arbitrariness in the analysis. Comparing results using random gene permutations and random sample permutations, respectively, we found that the assigned significance of a category depended strongly on the choice of null hypothesis. Compared to sample label permutations, gene permutations gave much smaller p-values for large categories with many coexpressed genes.

Conclusions: In gene category analyses of ranked gene lists, a cutoff independent score is preferable. The choice of null hypothesis is very important; random gene permutations does not work well as an approximation to sample label permutations.


Figures

Figure 1
Figure 1
Comparing null hypotheses. Comparison of p-values obtained by sample label permutations and gene permutations, using the data set of van 't Veer et al. [13] (left), Golub et al. [11] (middle), and Alon et al. [20] (right). Sample label permutation results were obtained with 100.000 permutations for the van 't Veer et al. data set and with 10.000 permutations for the other data sets. Gene permutation results were calculated as described in Methods. Red, green and blue colours represent categories with 1 to 5, 6 to 20, and over 20 genes, respectively. Encircled boxes in the left figure represent the categories "M phase" and "carboxylic acid metabolism", which are further discussed in the text.
Figure 2
Figure 2
Effects of coexpression on different null hypotheses. Expression profiles, over the 97 samples in van 't Veer et al. [13], of the 12 most highly ranked genes in the "M phase" category (left) and 13 most highly ranked genes in the "carboxylic acid metabolism" category (right), respectively. Some genes were inverted since the ranking was based on absolute correlation values to metastasis class. The metastasis free samples are to the left of the vertical line, and within each metastasis class, samples are ordered in increasing average expression of the examined genes. The expressions of each gene was normalized to zero average across samples. The narrower band of expressions in the left figure illustrates the higher Pearson correlation of M phase genes. Average absolute Pearson correlation between gene expressions was 0.74, with standard deviation of 0.16, for the M phase genes, and 0.44, with standard deviation of 0.27, for carboxylic acid metabolism genes.
Figure 3
Figure 3
Fitting an effective number of independent categories. The multiple category p-value, pmultiple, versus p-value for the data set of van 't Veer et al. [13], using 327 large Gene Ontology categories with more than 20 genes. The yellow band shows 95% confidence interval of sample label permutation results, based on 1000 random lists, and the blue curves show the results of Equation (1), with the fitted Neff = 152 (solid line), the total number of categories N = 327 (dashed line), and also the Bonferroni correction (dotted line).

References

    1. Zeeberg BR, Feng W, Wang G, Wang MD, Fojo AT, Sunshine M, Narasimhan S, Kane DW, Reinhold WC, Lababidi S, Bussey KJ, Riss J, Barrett JC, Weinstein JN. Gominer: a resource for biological interpretation of genomic and proteomic data. Genome Biol. 2003;4:R28. doi: 10.1186/gb-2003-4-4-r28. - DOI - PMC - PubMed
    1. Robinson MD, Grigull J, Mohammad N, Hughes TR. Funspec: a web-based cluster interpreter for yeast. BMC Bioinformatics. 2002;3:35. doi: 10.1186/1471-2105-3-35. - DOI - PMC - PubMed
    1. Khatri P, Draghici S, Ostermeier GC, Krawetz SA. Profiling gene expression using onto-express. Genomics. 2002;79:266–270. doi: 10.1006/geno.2002.6698. - DOI - PubMed
    1. Doniger SW, Salomonis N, Dahlquist KD, Vranizan K, Lawlor SC, Conklin BR. Mappfinder: using gene ontology and genmapp to create a global gene-expression profile from microarray data. Genome Biol. 2003;4:R7. doi: 10.1186/gb-2003-4-1-r7. - DOI - PMC - PubMed
    1. Beissbarth T, Speed T. GOstat: Find statistically overrepresented Gene Ontologies within a group of genes. Bioinformatics. 2004;20:1464–1465. doi: 10.1093/bioinformatics/bth088. - DOI - PubMed

Publication types

MeSH terms